
SPRING
2023
CLASS SYLLABUS
Instructor: Bruce Donald Campbell
Faculty, Web Design + Interactivity - RISD
Providence, RI
Adjunct Faculty Computer Science (research), Brown University
Providence, RI
Email: bcampbel01@risd.edu
Web: http://bdcampbell.net
Prerequisites: None
DESCRIPTION
Our information-saturated society is awash in data, but how do you give it useful form? This course provides an answer to students who build on their coding experience to develop a personal data acquisition process. This collection becomes a sustainable set of interest for use throughout the semester as they are given opportunities to investigate popular visualization libraries like Processing and D3.js. The class explores PHP and server-side JavaScript as middleware scripting languages for manipulating data, as well as JavaScript interaction features for exploring visual interfaces to data as a cognitive augmentation. A goal is to master the use of a relational database management system (RDBMS) like MySQL or PostgreSQL.
GRADING
Class participation - 10%
Data Project - 30%
Visualization project - 60%
RESOURCES
CLASS LINKS
- Motivational TED Talk (his portfolio)
- Color Brewer for informatics
- Paletton color scheme design tool
- D3 Gallery
- Vega Visualization Grammar
- GoJS Diagrams
- Python-based Boleh Package
- Processing Exhibition
- Robert Szucs's watershed maps
- Color Moves Tool
- Information Is Beautiful Awards
WEEKLY OUTLINE
TOPIC1
welcome and course overview
Course Overview
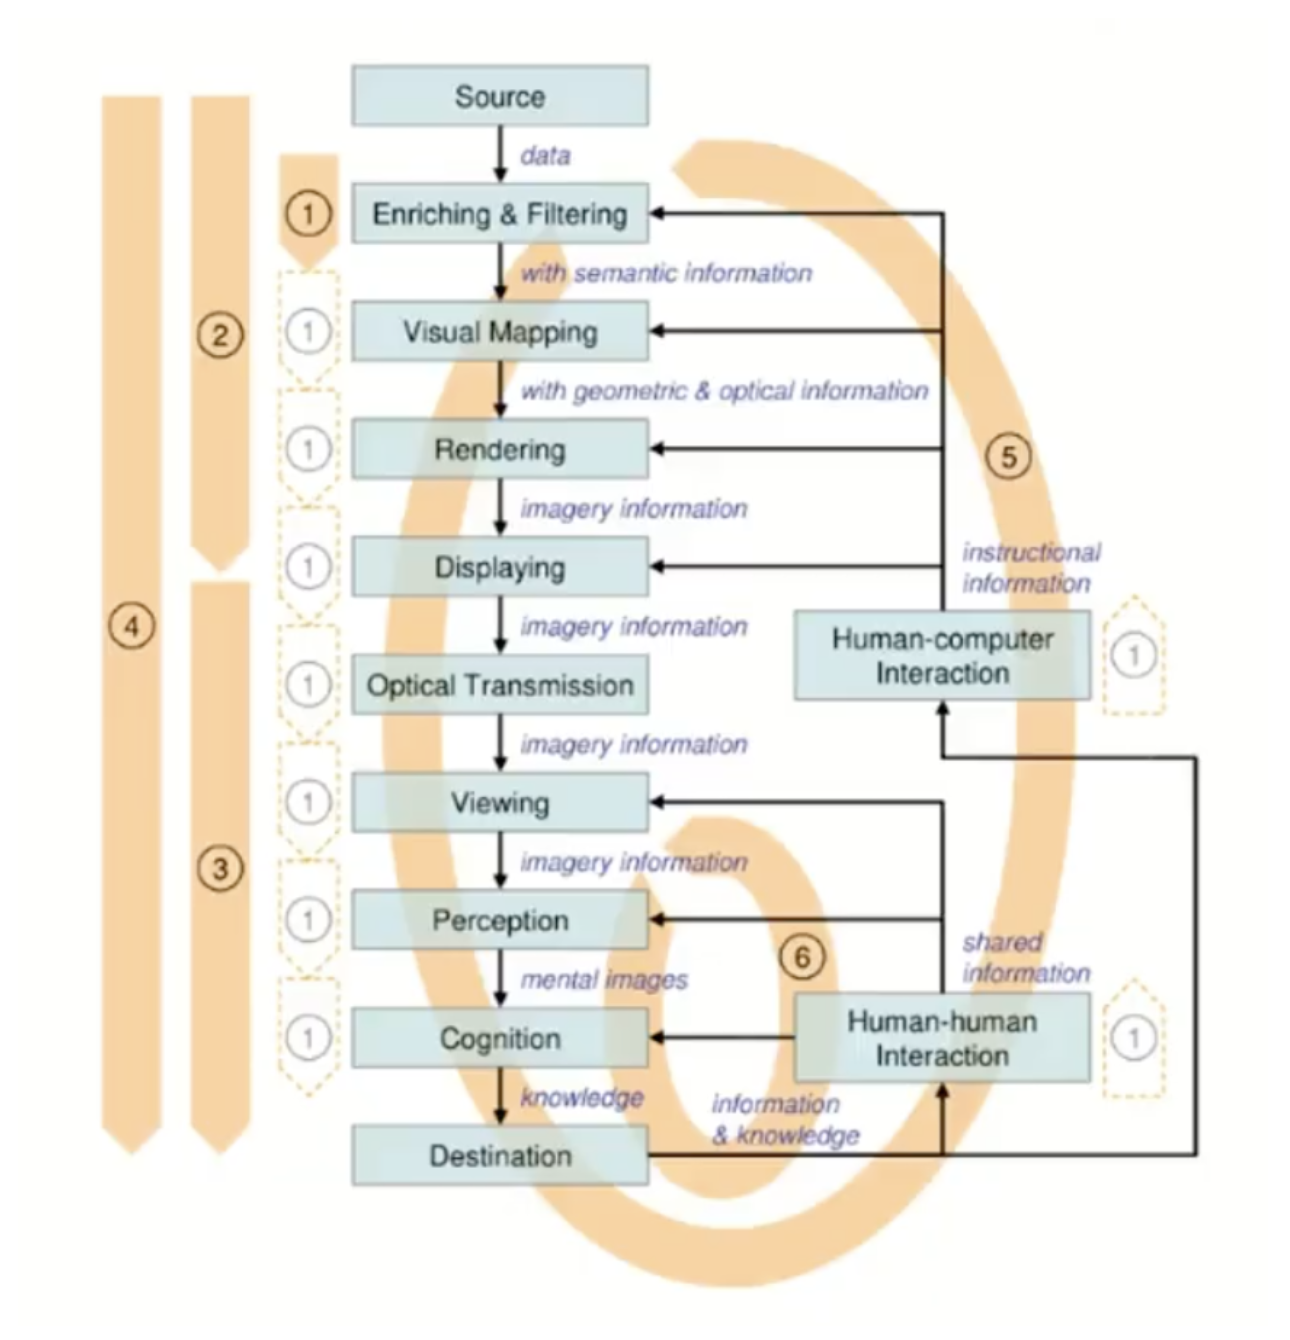
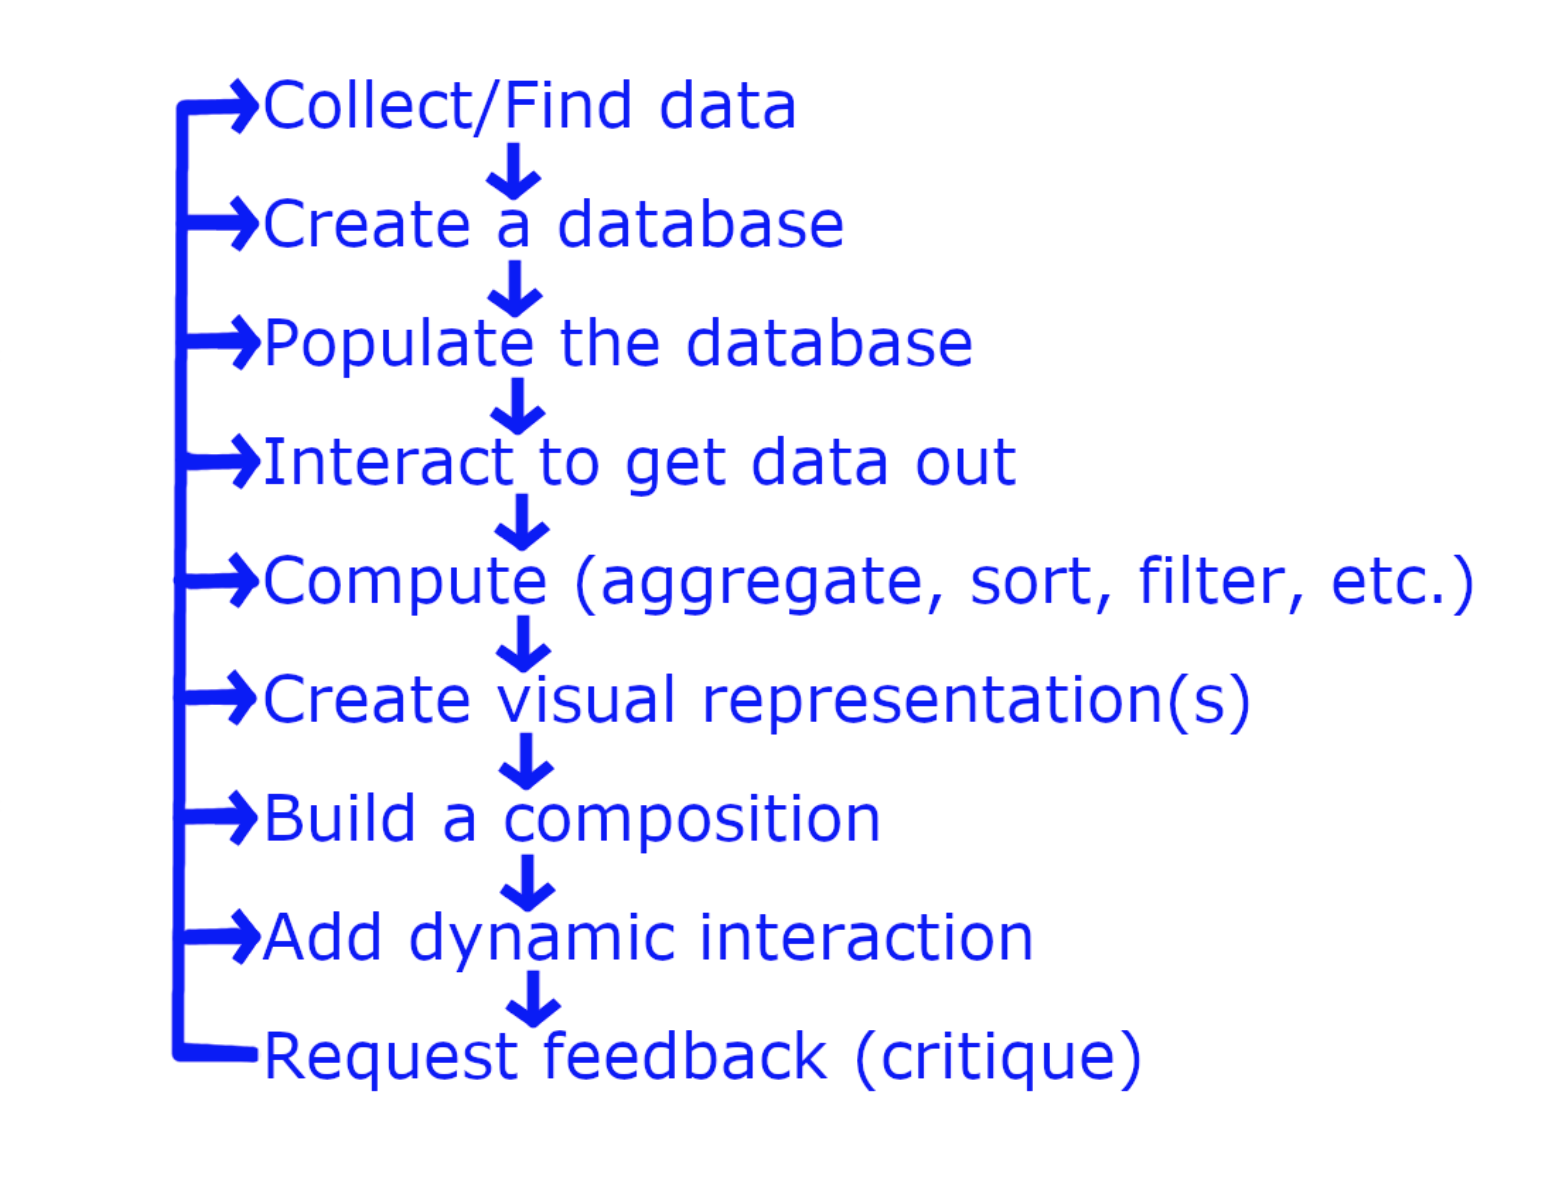
Data Visualization Pipelines
Visual Analytics
Data Visualization Techniques
Interactive Data Presentation
Dynamic Data Sources
Your Responsibilities in Class
Relational Database Management Systems
| Welcome to Class: |
| Getting Started With Data Visualization: |
| Installing and Using MAMP: |
Mac OS X: Installing Anaconda and Jupyter on Mac
Windows: Installing Anaconda and Jupyter on Windows
- Set up a Relational Database Management System using MAMP (and sample restaurant data)
- Base map generation exercise using JavaScript (see these notes and this grid creation tool)
- Exploration of the use of color ramps (see Samsel's paper on human perception)
- Introduction to Processing and D3
- Primer on the use of data visualization notebooks
- Begin the readings:
- Review activity done in class. Consider how to use an external image for a colormap in JavaScript.
TOPIC2
data processing and relational theory
A fuller context in which data visualization sits (it all begins with source data):
Data Quality Concerns
- Three distinct roles involved in useful relational database management systems use:
- Data Modeler
- Database Administrator
- Data Analyst
- Consider roles associated with a restaurant database
- Dynamic data mapping on base map exercise
By the end of this topic you will:
- understand the roles associated with relational database management systems
- have a sense of how to perform data modeling and why it is so valuable as a skill.
- understand how an electronic notebook works and how to export to HTML via bokeh
- have started a journey in understanding how JavaScript works with spatial data
Class Videos:
| Data Modeling and Data Acquisition: |
| A Data Management Case Study: |
| Visualizing Buoy Data: |
In Class:
- Work with week two exercises as seen in the videos above.
- Create an infrastructure to manage buoy data in MAMP
- Consider the restaurant database used in the data modeling example.
- Continue to dream up a data visualization project you want to work on.
Homework:
- Review activities done in videos. Consider how to mark buoy locations (and water temperature) in JavaScript.
- Feel free to play around with the Parts Tutorial (not required).
- Continue readings assigned in week one
TOPIC3
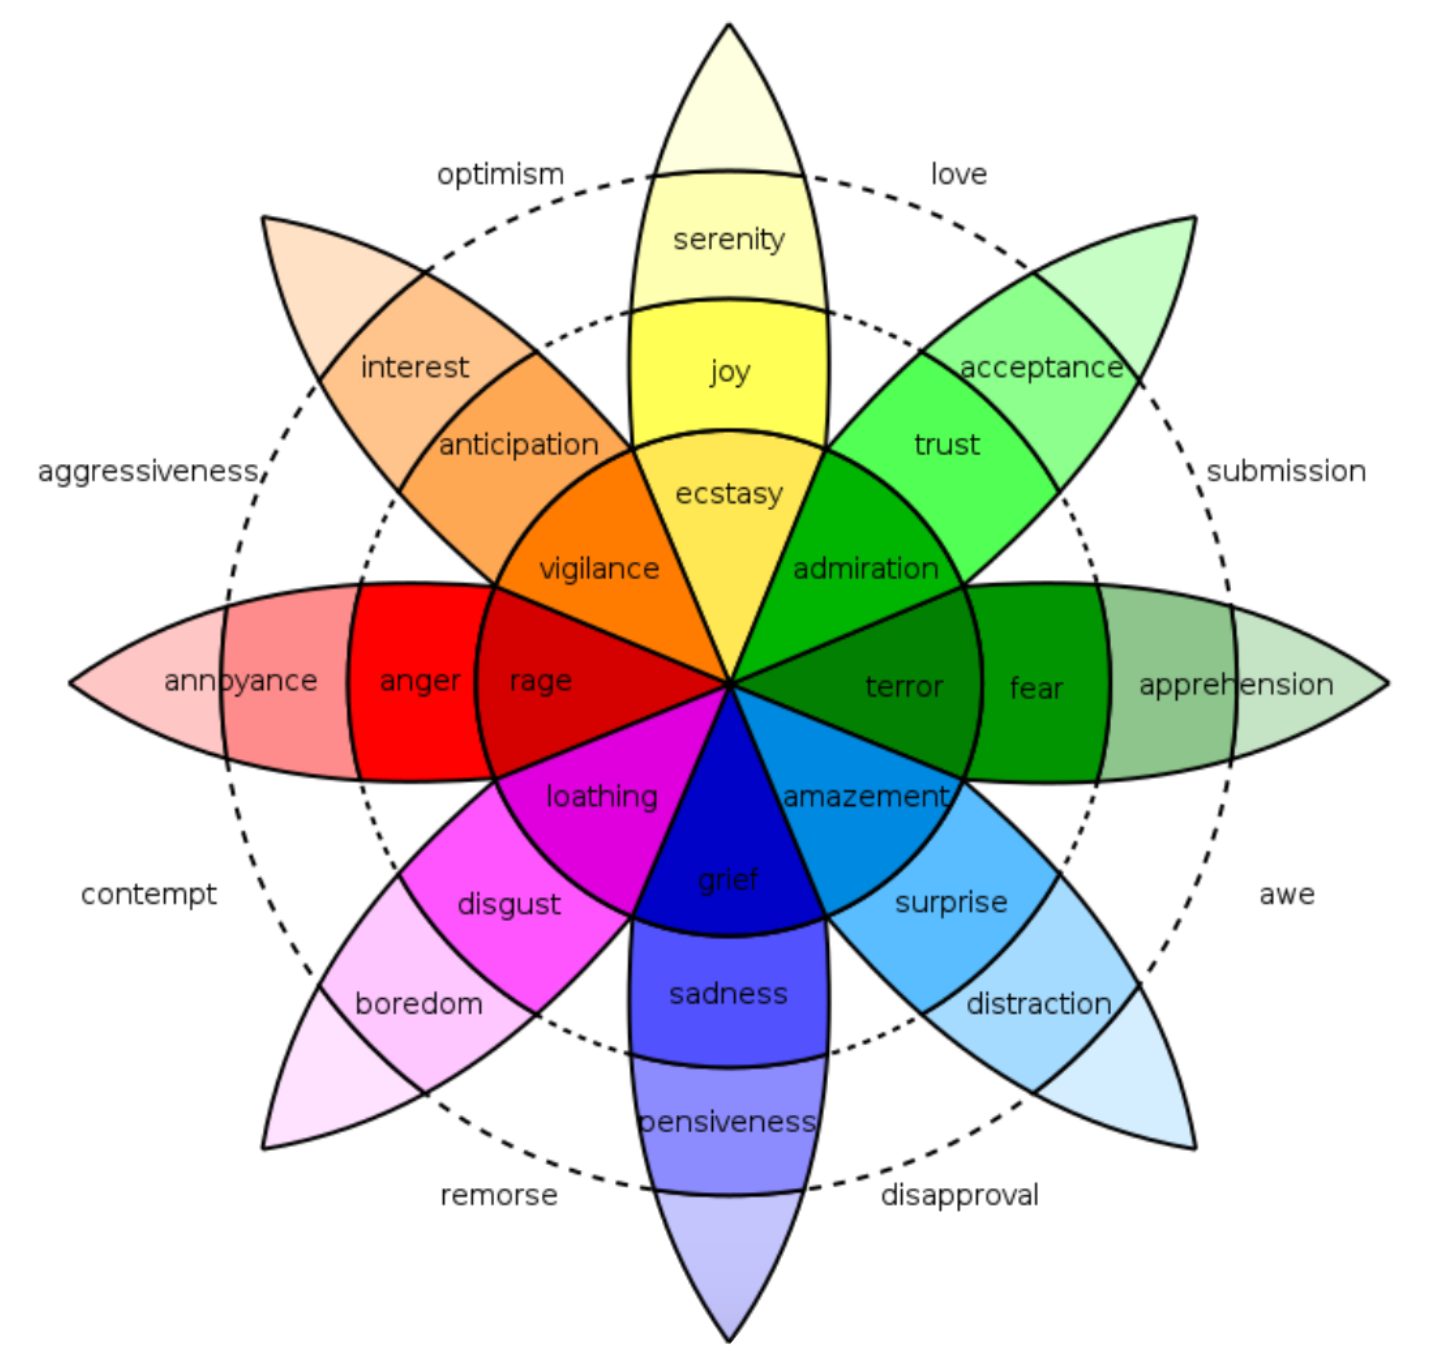
Color theory and seeing color
By the end of this topic you will:
- understand why color theory is so relevant to data visualization
- have a good orientation when considering the human visual system.
- understand how to get data of interest into a relational database management system
- continue your journey in understanding how JavaScript works with spatial data
- Review of seeing color and color theory readings
- Perform our third week exercises and reflect upon them
- Exercise: Color gradients (see notes here) — how many can you sense (blue v. green)
- Get a clear understanding of the data project so you can submit between now and topic 5
- Note the pilot class notes referenced in Video 3.
- Note the HTML5 Canvas Code Primer referenced in Video 3.
| Color Theory and the Human Visual System Discussion Primer: |
| Thoughts on the Data Project: |
| Visualization Approaches to Project Data: |
https://www.youtube.com/watch?v=llLVk2fqylA
- Begin organizing your data project
- Consider how you might use that data in a data visualization pipeline
- Review activities done in first three classes.
TOPIC4
analytical reasoning
- managing data in an RDMS
- Tables
- Attributes
- Queries
- Introduction to Visual Analytics and analytical reasoning
By the end of this topic you will:
- how to manage data in a relational database management system (RDMS)
- how to query data in an RDMS
- how to use JSON (JavaScript Object Notation) to share RDMS data
- continue your journey in understanding how JavaScript works in the database pipeline
- have been introduced to visual analytics as a focused use of data visualization
- Use of JSON data example #1
- Use of JSON data example #2
- Use of JSON data example #3
- Consider queries associated with the Parts Tutorial
- Visual representations: vector fields — showing 3-D on 2-D
- Analytical reasoning game by looking at a river flow analytics example
Topic 4 Videos:
| JSON Use in Data Visualization: |
Structured Query Language Video: Structured Query Language
Visual Analytics:
- Review activities done in first four classes.
- Work on your data and visualization projects
TOPIC5
data modeling
By the end of this topic you will:
- begin to incorporate visual analytics thinking in your data visualization work
- have some background to consider when thinking about data representation
- have thought about your own analytical reasoning instincts
- have thought about interactive data manipulation techniques
Topic 4 Videos:
| Other Data and Visualization Inspiration Sources: |
| Visual Analytics Interactivity: |
- Consider Kaggle as a source of data used in data visualization competitions.
- Consider the work of a visual analytics scientist.
- Consider data characteristics when choosing a data visualization technique.
- Consider sources of inspiration like information is beautiful and the visualizing data blog.
Homework:
- Review activities done in first five topics and work on your data and visualization projects.
- Turn in your data project as an SQL export, CSV, or JSON file by April 4th at 11:59pm.
- Investigate the Wikipedia Page on Data Modeling
- MySQL developers' take: Why you want to be good at data modeling
TOPIC6
interactive data visualization strategies
By the end of this topic you will:
- consider narrative as a context for sharing a data visualization
- understand the value of visualization in good story telling (and why the web supports that so well)
- have developed an internal dialogue regarding which genre to use in different scenarios
- have access to your classmates' projects and critique so you can learn through them.
In class:
- Review all the datasets that have come in from class and comment with ideas on visualization
| Data Project Review and Commentary: |
| Visualization Sketch Project Review and Commentary: |
- Review activities done in first six classes.
- Keep considering the data visualization galleries from Bokeh, D3 and GoJS
- Think about how your data might feed the examples in the galleries. What other data would you need to pursue to match the schema type of the data that is used in the examples.
- Most importantly, participate in critiquing data and visualization projects as you feel you can add value.
TOPIC7
Data representations and transformations
- The processing language and the artistic mind
- Examples of using processing for data vis
By the end of this topic you will:
- consider ideas on how to iterate upon your work with the data visualization pipeline.
- gain a clear understanding of every participant's data and visualization work in terms of process and intermediate result.
- understand how to participate in our data visualization studio.
- have started getting comfortable with using your data as a case study in data visualization that others can learn from.
- Review of the data visualization pipeline
- Examples of visual analytics
- Investigate D3 examples of global data visualization.
- In-class workshop for climate change project
Week 7 Videos:
| Participating in a Data Visualization Studio: |
The Technique of Data Visualization by Sketching Video
TOPIC8
iterating upon relational database content
1. Your Responsibilities in Class
2. Iteration on Data Visualization Pipeline Steps
3. Growing a Database with Relational Correctness
4. Adding Non-relational Content
By the end of this topic you will:
- take better advantage of relational database table joins.
- understand referential integrity and how an RDMS enforces it in your data.
- understand BLOBs and how to upload and download them from a file management system.
- have practiced intermediate standard query language commands with participant databases.
Week 8 Videos:
| Referential Integrity and the Importance of Relations for Growing Databases: |
| Working with BLOBS and Non-Relational Content: |
- Continue to work with each class participant's data and visualization code in MAMP.
- Work with base64 encoding (using the conversion link).
- Focus on the SQL that will create CSV and JSON outputs for visualization.
Readings:
- Notes on referential integrity
- Introduction to D3 (skim to get a sense of how its organized)
Homework:
- Prepare to participate in studio through sharing a description of your own process
- Submit your thoughts on how you would like to expand each participant's database
- Watch the videos and read the reading
TOPIC9
debugging JavaScript data visualization code
1. Using your browser's JavaScript console
2. The built-in logging capability
3. Interrogating performance and profiling
By the end of this topic you will:
- practice adapting a D3 visualization technique block to a different data source.
- practice debugging P5 applications.
- participate in debugging student code in our data visualization studio
- plan to integrate your data with visualization techniques suggested by sketches
Week 9 Videos:
| Data Visualization Sketches for Studio Consideration: |
| Debugging and Profiling Within D3 and P5: |
Debugging within the Firefox browser
(video web page debugged link here)
Debugging Within the Chrome Browser Video
(video web page debugged link here)
- Attempt your own D3 adaptation.
- Attempt your own P5 adaptation.
TOPIC10
layering techniques for data visualizations
1. Using z-index attributes to simplify code demands
2. Communication techniques between layers
By the end of this topic you will:
- understand how visualization layers benefit from layers similar to graphics manipulation software
- practice the use of z-index attribution
- investigate communication techniques for synchronizing layers
- make sure your latest iteration keeps clean model-view-controller delegation
Week 10 Videos:
| Using Layers in Data Visualizations: |
| Communications Between Layers and Model-View-Controller (MVC): |
Model-View-Controller Design Methodology: MVC Made Simple Video
Class Exercises:
- Attempt your own z-index layering
- Attempt implementation of a layer communications strategy
Readings:
- Continue to absorb the Discussion Forum posts as they discuss code and sketch results.
Homework:
- Prepare to participate in studio with your layering results
- Watch the videos and read all discussion posts
TOPIC11
JavaScript data visualization library integration
1. Cascading Script Techniques
2. NPM and other Package Managers
3. Three-dimensional Data Visualization
By the end of this topic you will:
- understand why JavaScript functionality is packaged in libraries and frameworks
- understand how to interrogate libraries for consideration of use
- understand why package managers are popular for collaboration teams
- practice integrating your data visualization into a package manager so others could contribute
Week 11 Videos:
| Using a Package Manager As a Project Grows: |
| JavaScript Libraries and Frameworks Integration: |
A Node Package Manager Primer Video: What is the Node Package Manager (NPM)?
Class Exercises:
- Attempt your own z-index layering
- Attempt implementation of a layer communications strategy
Readings:
- Creating JavaScript modules and managing them with package.json.
- How to use the Node Package Manager (NPM) to manage JavaScript modules.
- The VR-Viz Node Package as example of 3-D data visualization for the web.
Homework:
- Participate in studio with any data visualization components or iterations as they extend the studio data visualizations
- Watch the videos and read the readings
TOPIC12
discovery jam and project critique
1. Discovery through art-science collaborations
2. Project studio ends with critique
By the end of this topic you will:
- have experienced the roles involved in a discovery jam among artists and scientists
- have worked through your latest project iteration
- introduced your latest iteration for critique
- have externalized your data visualization pipeline process by documenting for others
Week 12 Videos:
| The Discovery Jam Phenomenon: |
| Review of Data Projects: |
| Review of Visualization Projects: |
Class Exercises:
- Attempt your own z-index layering
- Attempt implementation of a layer communications strategy
Readings:
- Shared in the Final Project Discussion Forum
Homework:
- Prepare to participate in studio with your layering results
- Watch the videos and read the reading
- Take a look at our class' final data visualization projects