 Thank you for inviting me to speak to you today. I am pleased to bring you details regarding the career of an accomplished
ocean science visualization mentor and colleague. Mark Stoermer graduated with an Ocean Engineering degree from this campus
in 1985 and went forth to make an impact at the University of Washington through the Center for Environmental Visualization
that he directed for 22 years. His work there grew up in parallel with many fascinating emergent ocean science research findings and
visualization techniques to help assist ocean scientists with performing and communicating their work. In this talk, I want
to convey the point of view Mark developed and patiently shared with the world. Besides many examples of beautiful visual
presentation examples, I aim to provide you what I believe should be very valuable notes from the way Mark organized and
delivered his work — always with energetic collaboration and iterative contemplation.
Thank you for inviting me to speak to you today. I am pleased to bring you details regarding the career of an accomplished
ocean science visualization mentor and colleague. Mark Stoermer graduated with an Ocean Engineering degree from this campus
in 1985 and went forth to make an impact at the University of Washington through the Center for Environmental Visualization
that he directed for 22 years. His work there grew up in parallel with many fascinating emergent ocean science research findings and
visualization techniques to help assist ocean scientists with performing and communicating their work. In this talk, I want
to convey the point of view Mark developed and patiently shared with the world. Besides many examples of beautiful visual
presentation examples, I aim to provide you what I believe should be very valuable notes from the way Mark organized and
delivered his work — always with energetic collaboration and iterative contemplation.
 I met Mark at the UW late in 1996 when we both attended an information session announcing a new research program with a new approach
called the Puget sound RegIonal Synthesis Model, or PRISM for short. The research was to be funded from a pot of funds that
were being collected through a 1% tax on operations for all departments on campus. The announcement suggested a program of work for the
next three years (it lasted over seven) that aimed to connect the various scientific models and research approaches on campus
into one overall connected scientific model and science community. Atmospheric models would be connected to hydrology models to be connected to
ocean circulation models to be connected to urban planning and civil engineering models. Any model that aimed to describe
the physical world for the Puget Sound region of western Washington state would be considered for integration.
I met Mark at the UW late in 1996 when we both attended an information session announcing a new research program with a new approach
called the Puget sound RegIonal Synthesis Model, or PRISM for short. The research was to be funded from a pot of funds that
were being collected through a 1% tax on operations for all departments on campus. The announcement suggested a program of work for the
next three years (it lasted over seven) that aimed to connect the various scientific models and research approaches on campus
into one overall connected scientific model and science community. Atmospheric models would be connected to hydrology models to be connected to
ocean circulation models to be connected to urban planning and civil engineering models. Any model that aimed to describe
the physical world for the Puget Sound region of western Washington state would be considered for integration.
For many who attended I noticed a hesitancy in them brought on by a disorganized series of presenters used to working
in comfortable domain-centric silos, but Mark and I found
each other immediately and spoke of the excitement of such an ambiguous and grand vision. We walked around campus, grabbed
a sandwich and realized we had some similarities: He had a degree from a midwestern large public state university and a degree
from one of the two smallest states in the country. His stories of The University of Cincinnati resonated with my stories of
the University of Wisconsin. My stories of the University of Delaware resonated with his stories of the University of Rhode Island.
Our degrees from the larger schools were filled with ambiguity and confusion (his ocean engineering program was disbanded
after his sophomore year, my information science program was down to six students after a new department head was thrown into two
years of tremendous bad luck with his family far away in Israel). We both thrived with ambiguity through passion and
resourcefulness at universities with tremendous facilities and people outside of our immediate departments.
Our degrees from small schools were filled with small
classes, individual attention, and established programs that let us delve into many tangential interests with faculty support.
Teaching was obviously very important (and infectious) to the small state faculty at the time we attended.
With our time at the University of Washington, our academic paths diverged as Mark had recently dropped a PhD course of study to start
a family (he told me he had a passion for ocean acoustics research but the qualifying process in Electrical Engineering at the UW would
demand he gain a very broad perspective and that seemed too tangential given his stage in life). I ramped up to pursue my PhD five years into
the time we worked, often supported enthusiastically by Mark, and drifted in and out of ocean science to get through my
qualifying exam and find funding for doctoral research. I told him he should feel free to come along for the ride. He did very
enthusiastically, especially when listening to me relate experiences from the front line.
 I was impressed with Mark's ability to focus on just the right number of goals to keep life interesting and yet make huge strides in
improving the quality of service CEV could provide ocean scientists. Mark showed an intense interest in the ocean and tracked research
of any collaborator who wanted visualization help. Spending time at the CEV, while collaborators came and went to get Mark's ear, one
could gain an education in ocean science — if they paid attention. Mark saw the process of facilitating ocean science as one of
coordinating data to visualization pipelines — through a network of people who performed processes that took advantage of hardware
and software that supported ocean science research. He saw art and artistic methods as critical to communicating ocean science. His vision
of work as a pipeline allowed him to isolate and iterate upon work techniques with the goal of reusing useful subtasks in future activities.
Always educating anyone who wanted to understand the tools and tasks better, he had an innate ability to optimize productivity over the long
run. He lectured me often early on about the merits of user-focused design and I admired the interviewing techniques he used to get to know
people outside of their immediate interests so he could better anticipate the form and function of what we could provide them. As a concerned
steward of the ocean, he played with ideas to reach a broader audience beyond the audience required of any one client.
I was impressed with Mark's ability to focus on just the right number of goals to keep life interesting and yet make huge strides in
improving the quality of service CEV could provide ocean scientists. Mark showed an intense interest in the ocean and tracked research
of any collaborator who wanted visualization help. Spending time at the CEV, while collaborators came and went to get Mark's ear, one
could gain an education in ocean science — if they paid attention. Mark saw the process of facilitating ocean science as one of
coordinating data to visualization pipelines — through a network of people who performed processes that took advantage of hardware
and software that supported ocean science research. He saw art and artistic methods as critical to communicating ocean science. His vision
of work as a pipeline allowed him to isolate and iterate upon work techniques with the goal of reusing useful subtasks in future activities.
Always educating anyone who wanted to understand the tools and tasks better, he had an innate ability to optimize productivity over the long
run. He lectured me often early on about the merits of user-focused design and I admired the interviewing techniques he used to get to know
people outside of their immediate interests so he could better anticipate the form and function of what we could provide them. As a concerned
steward of the ocean, he played with ideas to reach a broader audience beyond the audience required of any one client.
Mark was brilliant at pulling me back into focus on these topics. He could patiently listen to me head off on a tangent for a while, but he
would always bring me back to these priorities in our work. I was most stubborn regarding his consistent opinion that early amateurish versions of
work were not appropriate for sharing with a client. I was often impatient in wanting to assure the client that we had mastered their data
and data formatting for use in our work. Mark taught me how clients could become concerned with work that didn't have a professional finish
visually. I fought that for a long time but, as with everything else, Mark got me to come around to his point of view through patient demonstrations
and case studies of when unnecessary concern could have (and should have) been avoided.
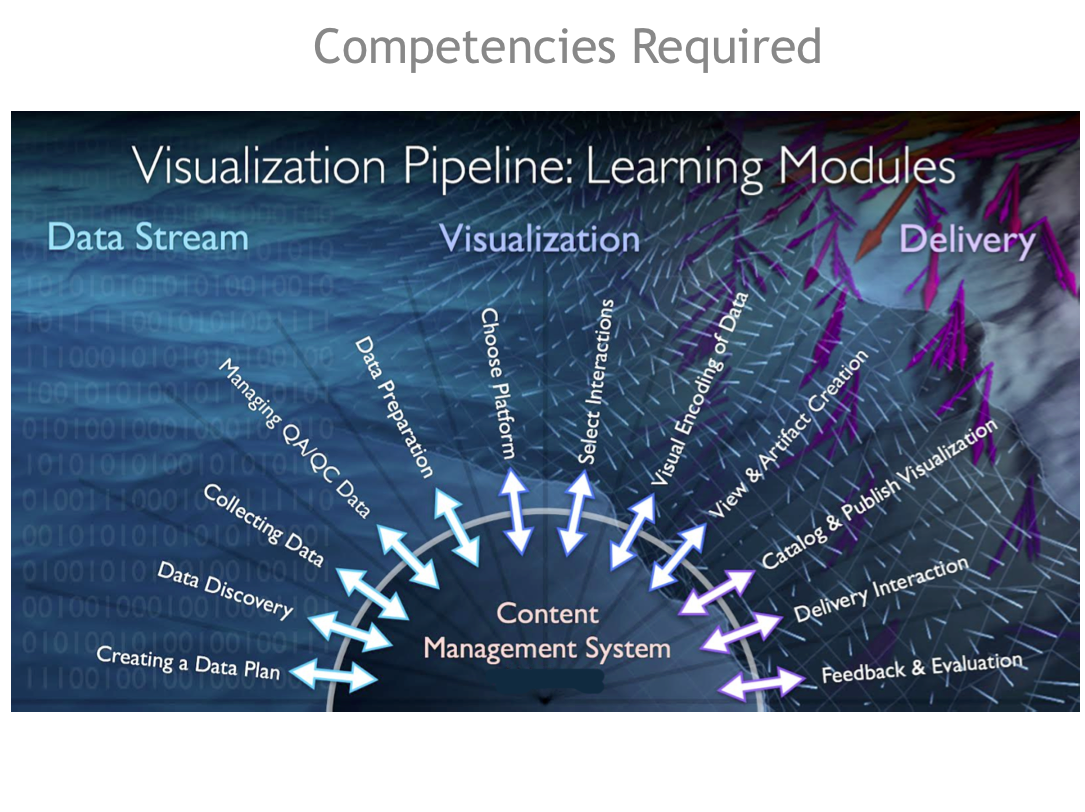 Mark's vision of a pipeline, that came from watching collaborations closely and picking apart how results best fomented, grew into a vision
demonstrated in the image above. After nineteen years of working together, I had the same visceral belief in the usefulness of visualization at every
step in an ocean science research activity. But, I didn't have the same elegant way of clustering and labeling those steps in a pipeline.
Mark referred to these steps here as Learning Modules. I have come to the conclusion that Mark used the emphasis on a student as user
in order to de-emphasize the role of an expert in such activities. By discussing ocean science research from the perspective of a student, we
could assume every sub-activity (module) would benefit from study, experience, and iteration. We saw so many changes in tools, techniques, and
approaches that could improve any one of these sub-activities that we ourselves were always iterating to become better and more efficient at those
tasks we were asked to participate in. Very often, a collaborator would contact us after the first half of the pipeline had already been accomplished.
I learned what an unfortunate situation that was when it came to Mark's contribution. Mark was very accomplished in the full pipeline and deserved to
be part of a project from the get-go. We learned with each visualization we shared with each other — visualizations of the research plan taught
us as much as the final visualization product that was delivered and evaluated. The more we learned, the more context we had for each new task we needed
to perform.
Mark's vision of a pipeline, that came from watching collaborations closely and picking apart how results best fomented, grew into a vision
demonstrated in the image above. After nineteen years of working together, I had the same visceral belief in the usefulness of visualization at every
step in an ocean science research activity. But, I didn't have the same elegant way of clustering and labeling those steps in a pipeline.
Mark referred to these steps here as Learning Modules. I have come to the conclusion that Mark used the emphasis on a student as user
in order to de-emphasize the role of an expert in such activities. By discussing ocean science research from the perspective of a student, we
could assume every sub-activity (module) would benefit from study, experience, and iteration. We saw so many changes in tools, techniques, and
approaches that could improve any one of these sub-activities that we ourselves were always iterating to become better and more efficient at those
tasks we were asked to participate in. Very often, a collaborator would contact us after the first half of the pipeline had already been accomplished.
I learned what an unfortunate situation that was when it came to Mark's contribution. Mark was very accomplished in the full pipeline and deserved to
be part of a project from the get-go. We learned with each visualization we shared with each other — visualizations of the research plan taught
us as much as the final visualization product that was delivered and evaluated. The more we learned, the more context we had for each new task we needed
to perform.
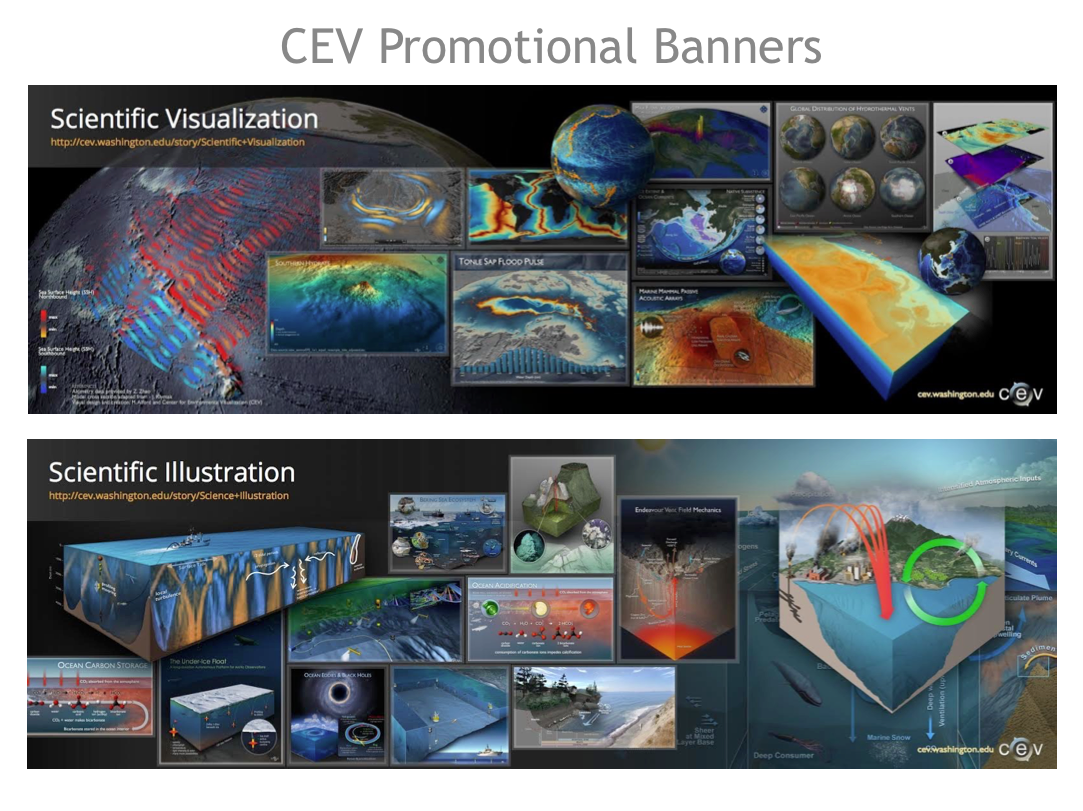 Mark also became a master educator in clustering our work into product types and educating potential clients about the merits of each. I present the
six banners Mark used to promote CEV services as an example of the quality of the work performed (each thumbnail shown on each banner represents a
large final version produced for a client). The work presented in these banners can be seen in larger formats from within the gallery provided on the
CEV website (at http://cev.washington.edu/). The distinction between these first two banners is primarily a distinction in the user of the visualization.
Scientific visualization presents scientific data in its best light to support a scientist's immediate research contributions. Scientific illustration
provides a broader artistic license to inject context and descriptive elements for an audience that might have less background knowledge for the
visualization content.
Mark also became a master educator in clustering our work into product types and educating potential clients about the merits of each. I present the
six banners Mark used to promote CEV services as an example of the quality of the work performed (each thumbnail shown on each banner represents a
large final version produced for a client). The work presented in these banners can be seen in larger formats from within the gallery provided on the
CEV website (at http://cev.washington.edu/). The distinction between these first two banners is primarily a distinction in the user of the visualization.
Scientific visualization presents scientific data in its best light to support a scientist's immediate research contributions. Scientific illustration
provides a broader artistic license to inject context and descriptive elements for an audience that might have less background knowledge for the
visualization content.
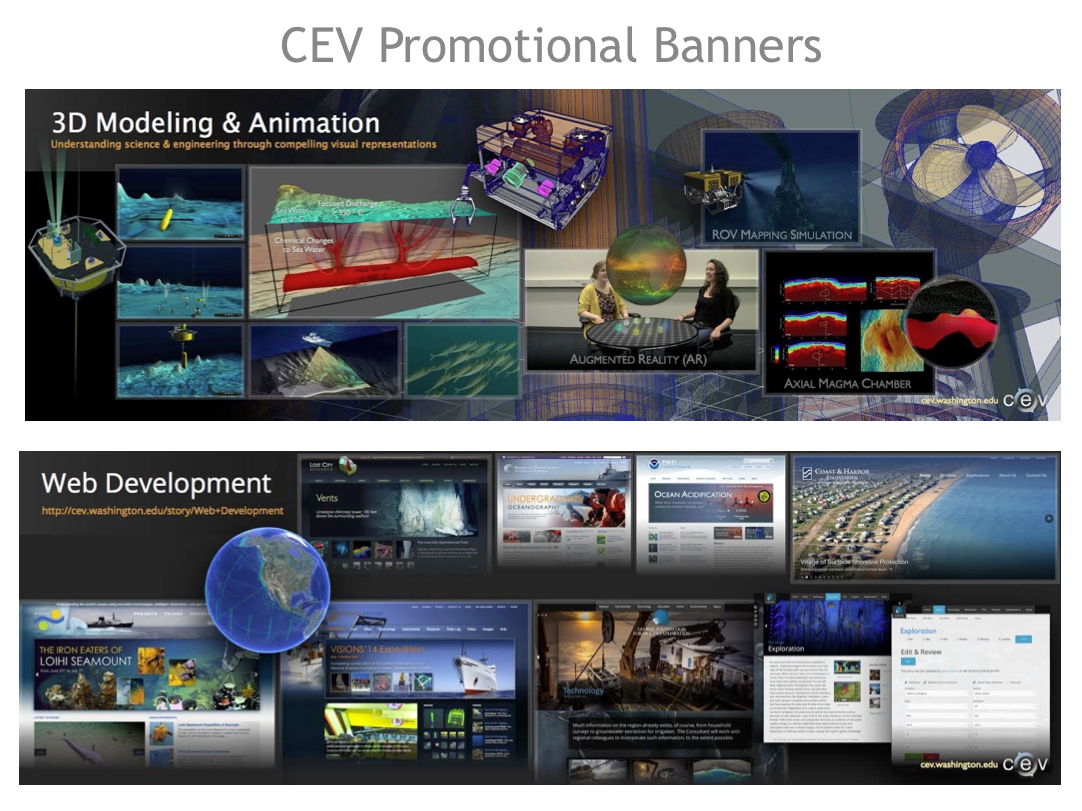 CEV performs 3D Modeling of research-related tools, equipment, and geographical entities that are involved in many science activities. The catalog
of models provided provides fodder as content for new visualizations. Animations demonstrate the contribution of modeled content to exploring a natural
phenomenon and as such are often tightly-coupled in generating useful products. When we started off creating content for web publication, the process
could require the use of tools, techniques, and file formats that were unlike creating content for other delivery methods. As a result, many of the
Web Development gallery items were web-only products. Over time, as we worked, we saw convergences of the pipelines for web and other delivery and
became enthusiastic to work on new, dual-purpose pipelines.
CEV performs 3D Modeling of research-related tools, equipment, and geographical entities that are involved in many science activities. The catalog
of models provided provides fodder as content for new visualizations. Animations demonstrate the contribution of modeled content to exploring a natural
phenomenon and as such are often tightly-coupled in generating useful products. When we started off creating content for web publication, the process
could require the use of tools, techniques, and file formats that were unlike creating content for other delivery methods. As a result, many of the
Web Development gallery items were web-only products. Over time, as we worked, we saw convergences of the pipelines for web and other delivery and
became enthusiastic to work on new, dual-purpose pipelines.
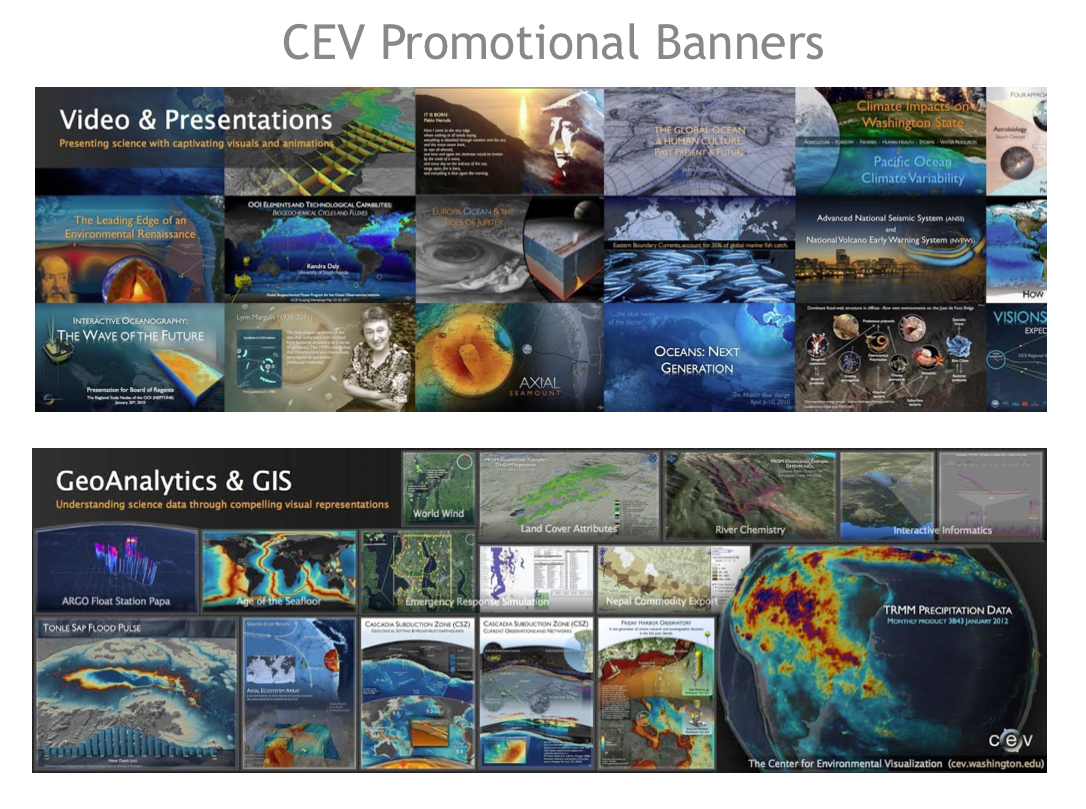 Off all the delivery formats we pursued, video and slide presentations seemed to bring the CEV team together best. Mark must have thought we could have
been a movie-making operation and thrive. But, our client base needed all the delivery formats if we were going to best serve them. I personally began
to dabble in GeoAnalytics as a specialty, and CEV did deliver on quite a few GeoAnalytic projects, but we never got to the point of having had a history
of iterations to teach us to be visionary, efficient GeoAnalytical product developers. I do believe that is where we were likely to head successfully
with Mark's continued leadership. Literacy with using geo-analytical products continues to grow via web accessibility. The UW has a longer history with
GIS than most other campuses. Ocean scientists often had their own GIS expert available to work with on a project. Our contribution was often limited to
display mapping in those cases.
Off all the delivery formats we pursued, video and slide presentations seemed to bring the CEV team together best. Mark must have thought we could have
been a movie-making operation and thrive. But, our client base needed all the delivery formats if we were going to best serve them. I personally began
to dabble in GeoAnalytics as a specialty, and CEV did deliver on quite a few GeoAnalytic projects, but we never got to the point of having had a history
of iterations to teach us to be visionary, efficient GeoAnalytical product developers. I do believe that is where we were likely to head successfully
with Mark's continued leadership. Literacy with using geo-analytical products continues to grow via web accessibility. The UW has a longer history with
GIS than most other campuses. Ocean scientists often had their own GIS expert available to work with on a project. Our contribution was often limited to
display mapping in those cases.
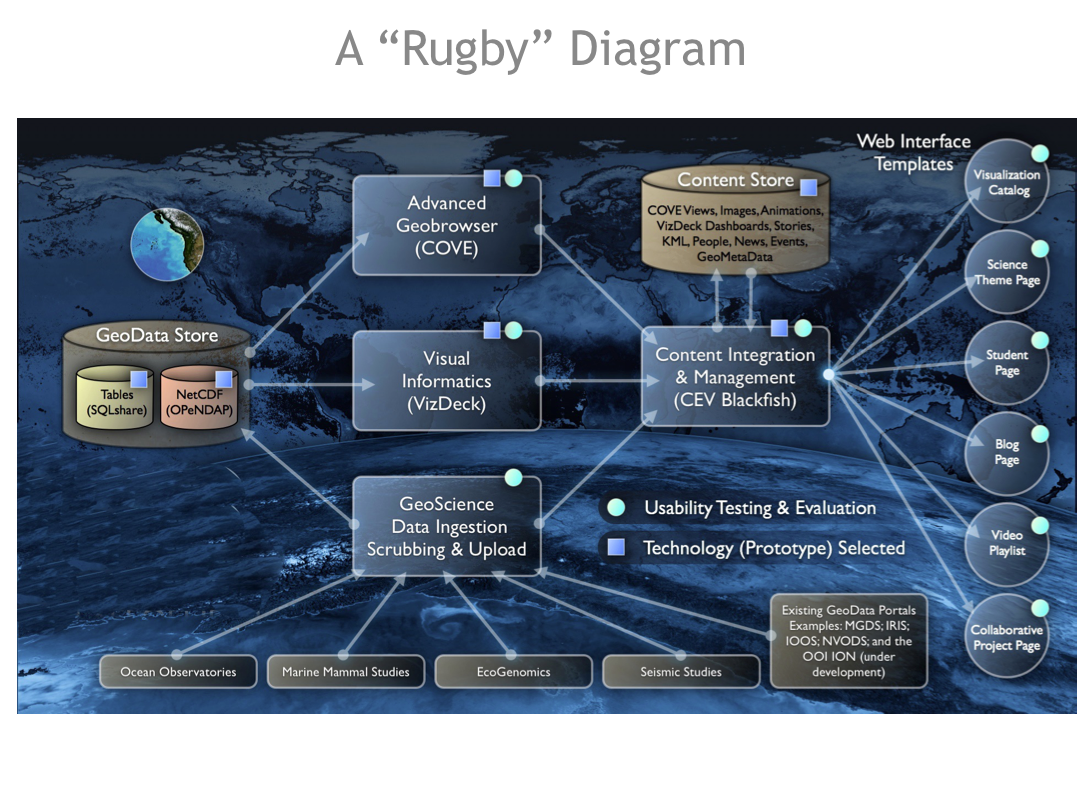 As we built up a vision for data to visualization pipelines, we spent more and more time sketching out useful implementations that could bundle
pipeline tasks into an overall, coherent whole. Mark coined these diagrams "Rugby" diagrams because he thought fifteen elements was just about the
maximum number of visual elements such sketches should contain. The image above is an example of a rugby diagram Mark used often to educate on possible
collaborations that would better reuse people's time and resources into rapidly producing visualization products.
As we built up a vision for data to visualization pipelines, we spent more and more time sketching out useful implementations that could bundle
pipeline tasks into an overall, coherent whole. Mark coined these diagrams "Rugby" diagrams because he thought fifteen elements was just about the
maximum number of visual elements such sketches should contain. The image above is an example of a rugby diagram Mark used often to educate on possible
collaborations that would better reuse people's time and resources into rapidly producing visualization products.
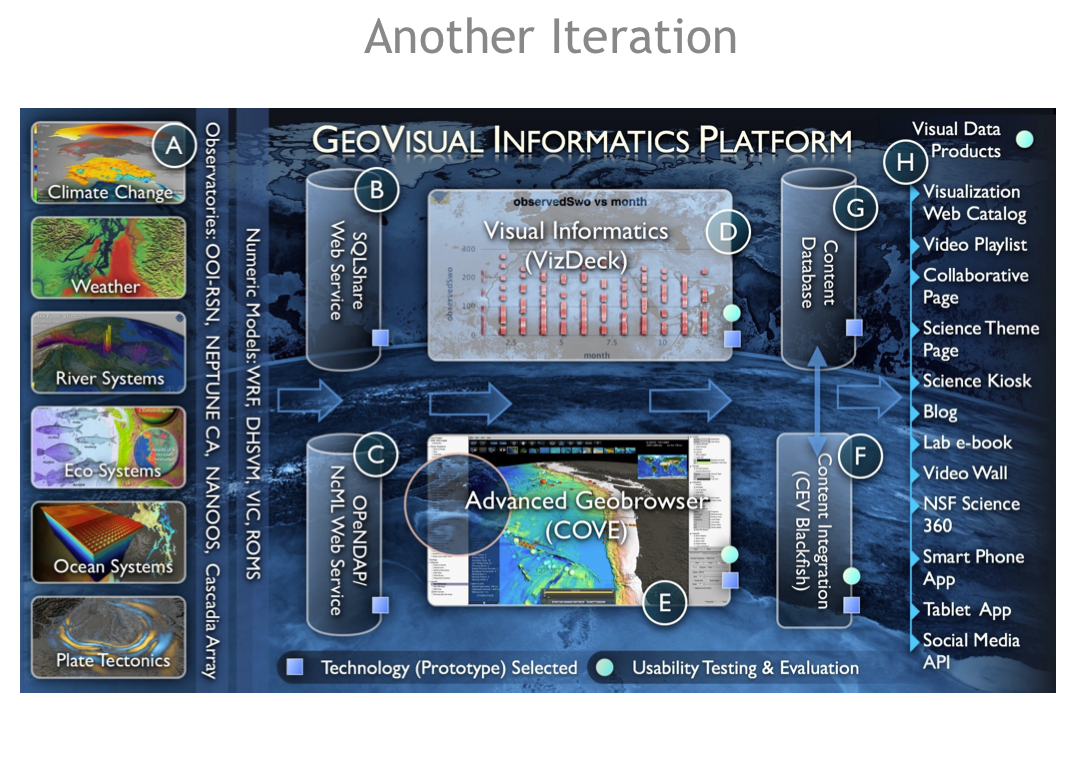 That sketch evolved into a full GeoVisual Informatics Platform illustration that could support student study of the ocean on any technology they might
have access to. As in the previous slide (where a box labeled Content Integration & Management suggested CEV's focus within a collaboration), Mark used
this diagram to promote the usefulness of an Advanced Geobrowser (named COVE as described further below). In the course of twenty minutes, Mark could
adapt this vision to a particular implementation — the most often of which was a specialized classroom that every school would have for focusing
on earth and ocean science learning (the co-called the DEC - Digital Electronic Classroom).
That sketch evolved into a full GeoVisual Informatics Platform illustration that could support student study of the ocean on any technology they might
have access to. As in the previous slide (where a box labeled Content Integration & Management suggested CEV's focus within a collaboration), Mark used
this diagram to promote the usefulness of an Advanced Geobrowser (named COVE as described further below). In the course of twenty minutes, Mark could
adapt this vision to a particular implementation — the most often of which was a specialized classroom that every school would have for focusing
on earth and ocean science learning (the co-called the DEC - Digital Electronic Classroom).
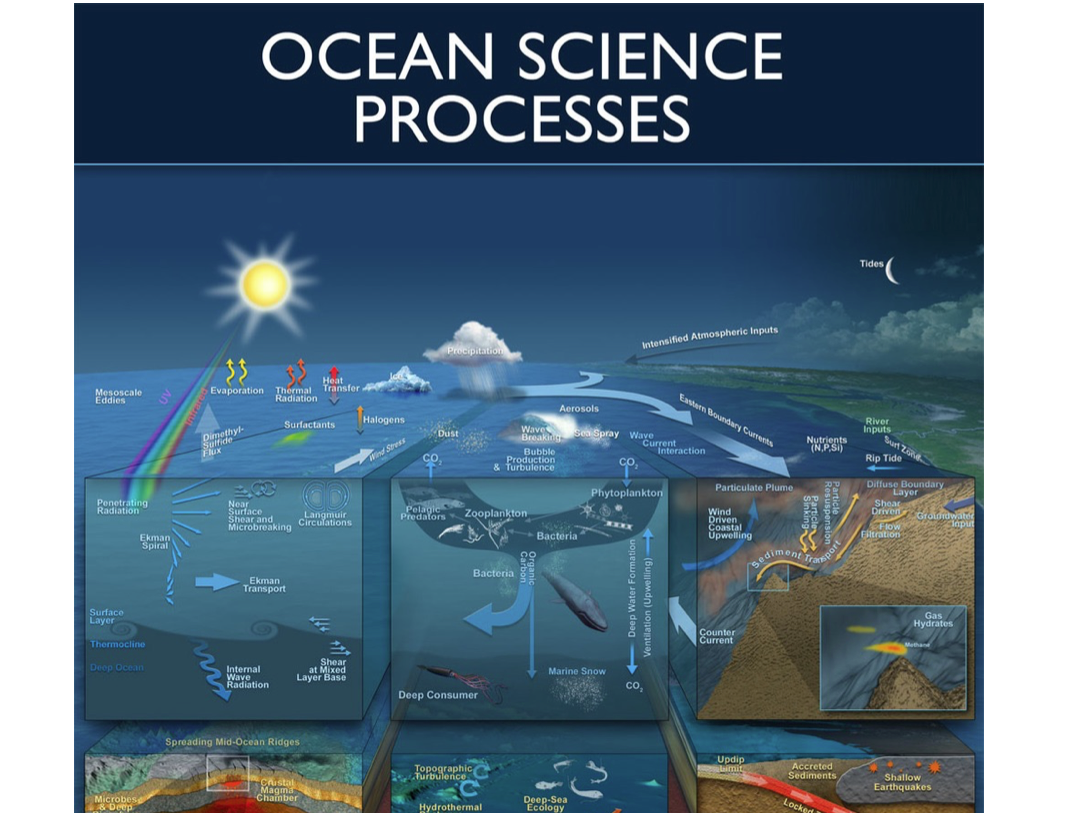 Mark and CEV artist Hunter maintained a poster of ocean science processes that could educate anyone about the nature of the ocean, and the way scientists
divide up science programs to focus on bounded areas of interest. The diagram represents well the interests of twenty years of CEV clients and collaborators.
If a new client were to show up and share a research direction that was not well represented on this poster, that component would surely be added sooner
than later. I can see a face associated with most of the labels on the poster, and when not, I still have a rich mind's eye of words and images associated
with the term. The CEV, under Mark's tenure, was a place for learning about and learning to care for the ocean. That learning provided no better resonance
for motivating any work task we had to perform.
Mark and CEV artist Hunter maintained a poster of ocean science processes that could educate anyone about the nature of the ocean, and the way scientists
divide up science programs to focus on bounded areas of interest. The diagram represents well the interests of twenty years of CEV clients and collaborators.
If a new client were to show up and share a research direction that was not well represented on this poster, that component would surely be added sooner
than later. I can see a face associated with most of the labels on the poster, and when not, I still have a rich mind's eye of words and images associated
with the term. The CEV, under Mark's tenure, was a place for learning about and learning to care for the ocean. That learning provided no better resonance
for motivating any work task we had to perform.
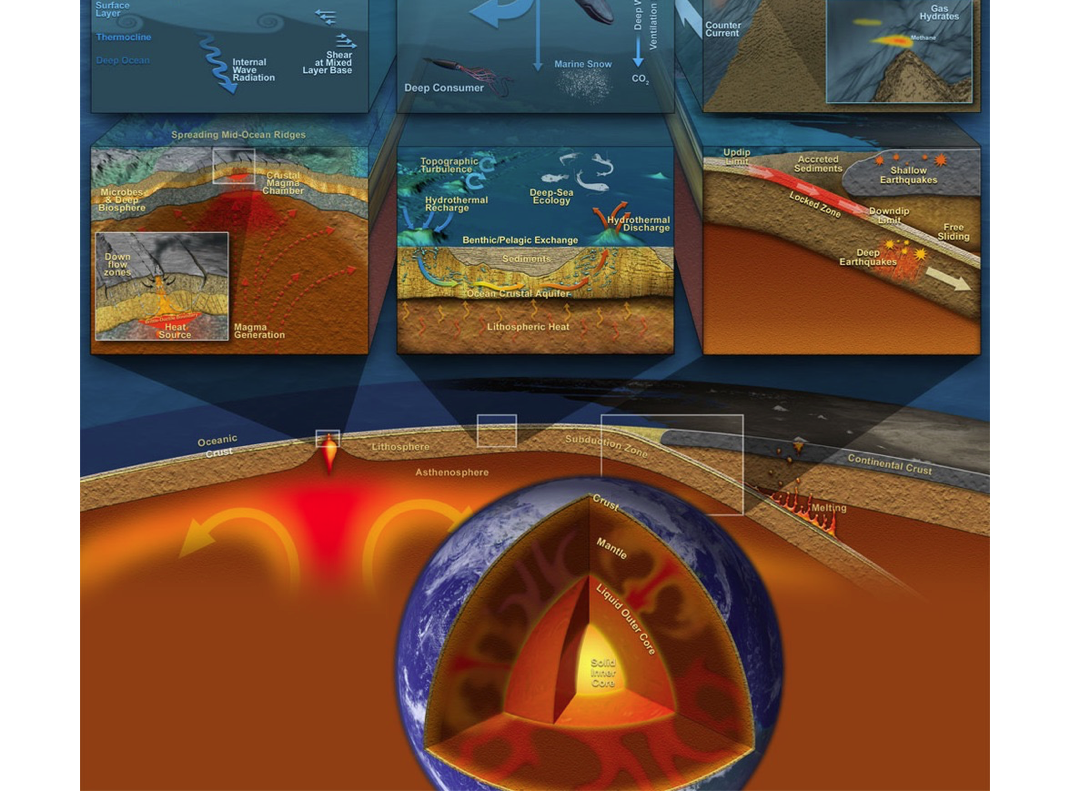 The lowest regions of the poster have become my most recent areas of interest and work. It feels like all the stuff above the deep weighs heavily upon
the deep. The familiarity of the upper areas from the ability to see them in action provides quite a contrast to the strangeness made familiar of things
we have had very little ability to experience first-hand in life. Innovative science and advanced engineering skills are changing that slowly and surely through
real-time video and real-time sensing that streams data ashore.
The lowest regions of the poster have become my most recent areas of interest and work. It feels like all the stuff above the deep weighs heavily upon
the deep. The familiarity of the upper areas from the ability to see them in action provides quite a contrast to the strangeness made familiar of things
we have had very little ability to experience first-hand in life. Innovative science and advanced engineering skills are changing that slowly and surely through
real-time video and real-time sensing that streams data ashore.
 The first ten years of working with Mark and the CEV grew to become a tremendous experience of daily investigation and discovery.
The CEV kept trying out software, artistic tools, programming languages, and back-end facilities for supporting our workflow. Our
workflow was constantly pushed forward by the negotiated needs of our clients — negotiated via a process of clients suggesting
what they thought they needed from us, and us suggesting a different process based on what we had done for other clients and
the successes we thought those processes had brought.
The first ten years of working with Mark and the CEV grew to become a tremendous experience of daily investigation and discovery.
The CEV kept trying out software, artistic tools, programming languages, and back-end facilities for supporting our workflow. Our
workflow was constantly pushed forward by the negotiated needs of our clients — negotiated via a process of clients suggesting
what they thought they needed from us, and us suggesting a different process based on what we had done for other clients and
the successes we thought those processes had brought.
In retrospect, I would suggest that Mark's way of working had a certain
genius to it. Had Mark had a personality like Steve Jobs, we all could have been herded like cats into an effective team all
driving Mark's vision aggressively. But, alas, we were not all keen to work 100 hour weeks, were not really good at the stresses
brought on by deadlines, and were used to the campus' academic environment whereby a tangential interest was bound to occupy a
fair amount of time away from critical paths toward CEV's immediate client goals. We all relied on Mark's relentless commitment to
his workflow and the tremendous ability he had to streamline whatever we were needing to do. I realized I could dismiss or ignore
Mark's recommendations at my peril. And yet, Mark's recommendations came from his wonderful ability to ask questions and understand
what we did to support our clients. He fed back to us recommendations to use tools and techniques we had demonstrated in the past but
perhaps didn't see clearly as relevant to work ahead of us.
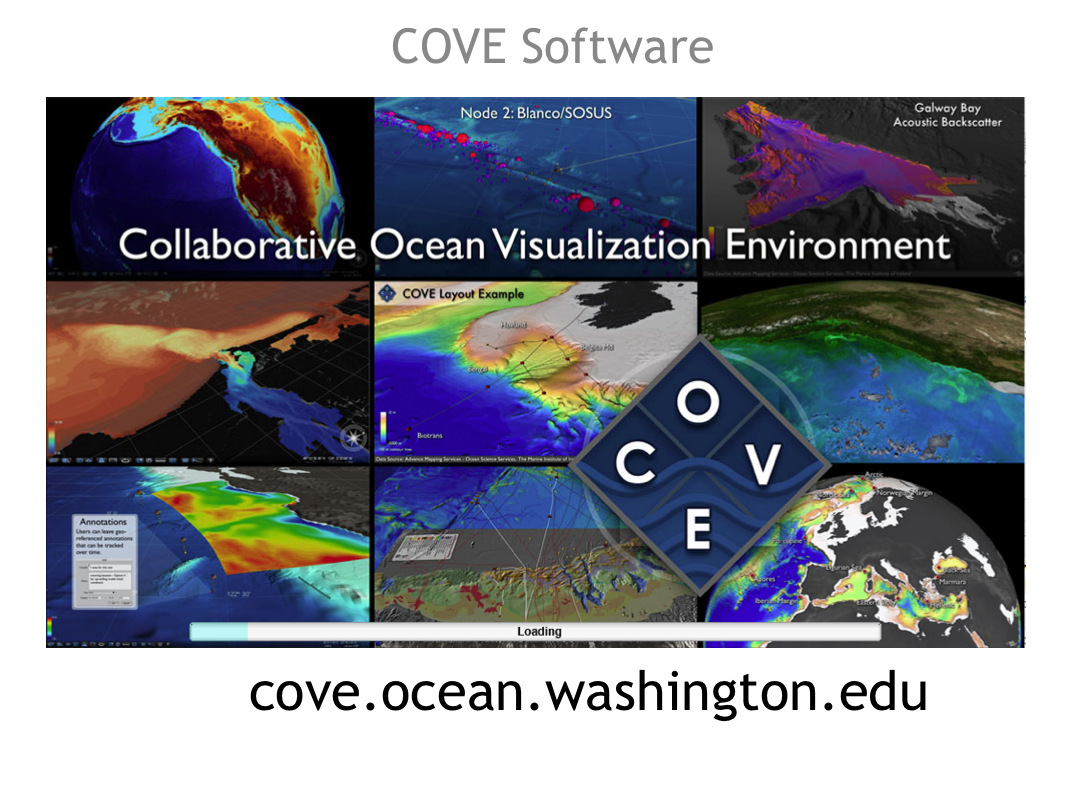
After ten years of working in hodge-podge fashion — putting together work processes with duct tape and bailing wire as Mark
called it — we began to have a vision for the ideal software pipeline we would need to support 80% of our client's visualization
needs. Though we couldn't ever raise the funding to build such a tool ourselves (when older technologies would make the process
more expensive than current day), and could never find the time to build something in our spare time, we did start to see a
relationship with the UW computer science department grow. We were provided a tremendous undergraduate student who built
software environments that demonstrated much of what we were after, and eventually were given a gifted PhD candidate to work
with in generating a powerful software tool for ocean science visualization. The result of that work is the Collaborative Ocean
Visualization Environment (COVE) software available as as-is warranty freeware at
cove.ocean.washington.edu.
 At this point in the talk, I showed two videos that demonstrate the outputs of the COVE software and the workflow the CEV team
followed in using COVE (as well as the potential to inject COVE's visualization engine into other visualization enviornments
— including the virtual reality theater that Brown University calls its YURT).
At this point in the talk, I showed two videos that demonstrate the outputs of the COVE software and the workflow the CEV team
followed in using COVE (as well as the potential to inject COVE's visualization engine into other visualization enviornments
— including the virtual reality theater that Brown University calls its YURT).
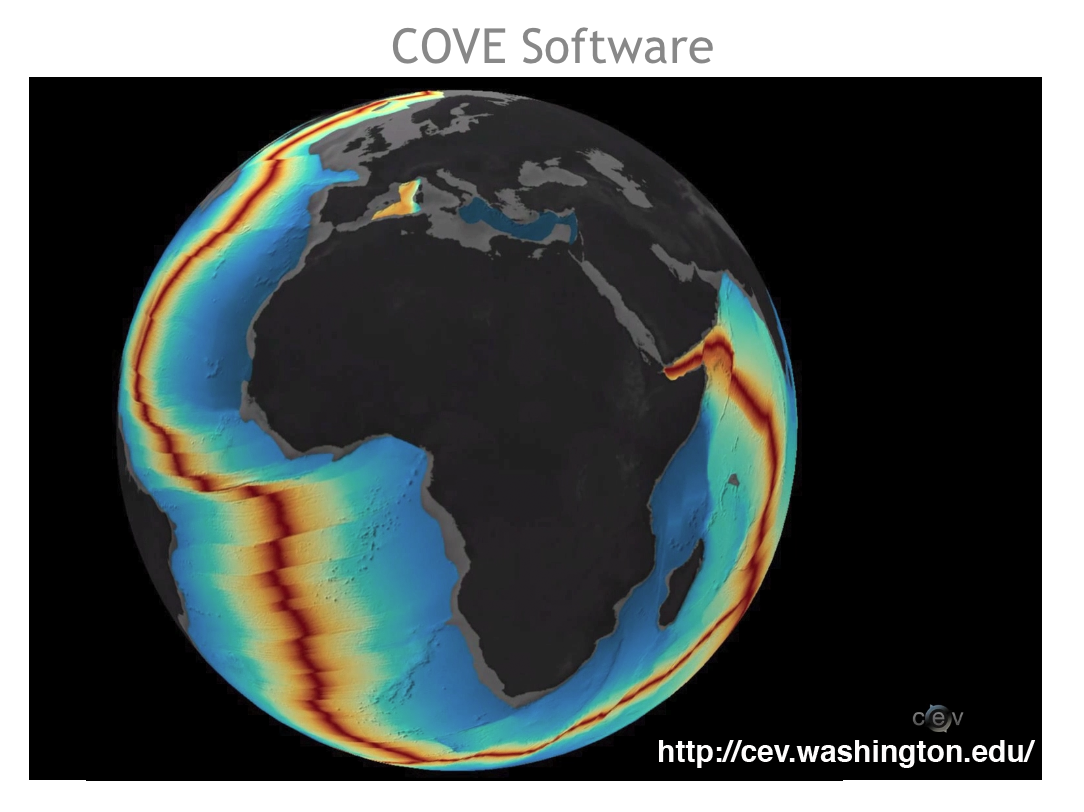
The image above shows the starting point for the first video — a presentation of the age of ocean-floor crust as a by-product
of seafloor spreading associated with tectonic drift worldwide. The planet spins for a full tour before brining you down under
the ocean to a visualization of the Axial seamount (130 degrees north, 46 degrees west). Most of the content used for video
production is represented in the gallery associated with the CEV website at
cev.washington.edu. The videos ran for about eight minutes without soundtrack (I provided a voiceover partially because
the acoustics in the room were not particularly rich enough to capture the full emotion of music used in the videos).
 Of all of Mark's skills as a visualization product team lead, I suspect I admired his staffing insights best of all. Mark had a
way of assigning tasks in a "who wants it most" manner. I really enjoyed being able to pick and choose from our workflow and then
mentoring others in those tasks for which I was best suited, but perhaps less interested. Given how enthusiastic at the CEV seemed
at all times, I feel pretty confident my co-workers felt that way too. Mark seemed to enjoy doing all tasks, though he often
suggested he was "struggling, struggling" when I asked how he was doing on something. I had to ask to get a sense of that as
otherwise it seemed he was always prodding effectively forward on anything he set out to do.
Of all of Mark's skills as a visualization product team lead, I suspect I admired his staffing insights best of all. Mark had a
way of assigning tasks in a "who wants it most" manner. I really enjoyed being able to pick and choose from our workflow and then
mentoring others in those tasks for which I was best suited, but perhaps less interested. Given how enthusiastic at the CEV seemed
at all times, I feel pretty confident my co-workers felt that way too. Mark seemed to enjoy doing all tasks, though he often
suggested he was "struggling, struggling" when I asked how he was doing on something. I had to ask to get a sense of that as
otherwise it seemed he was always prodding effectively forward on anything he set out to do.
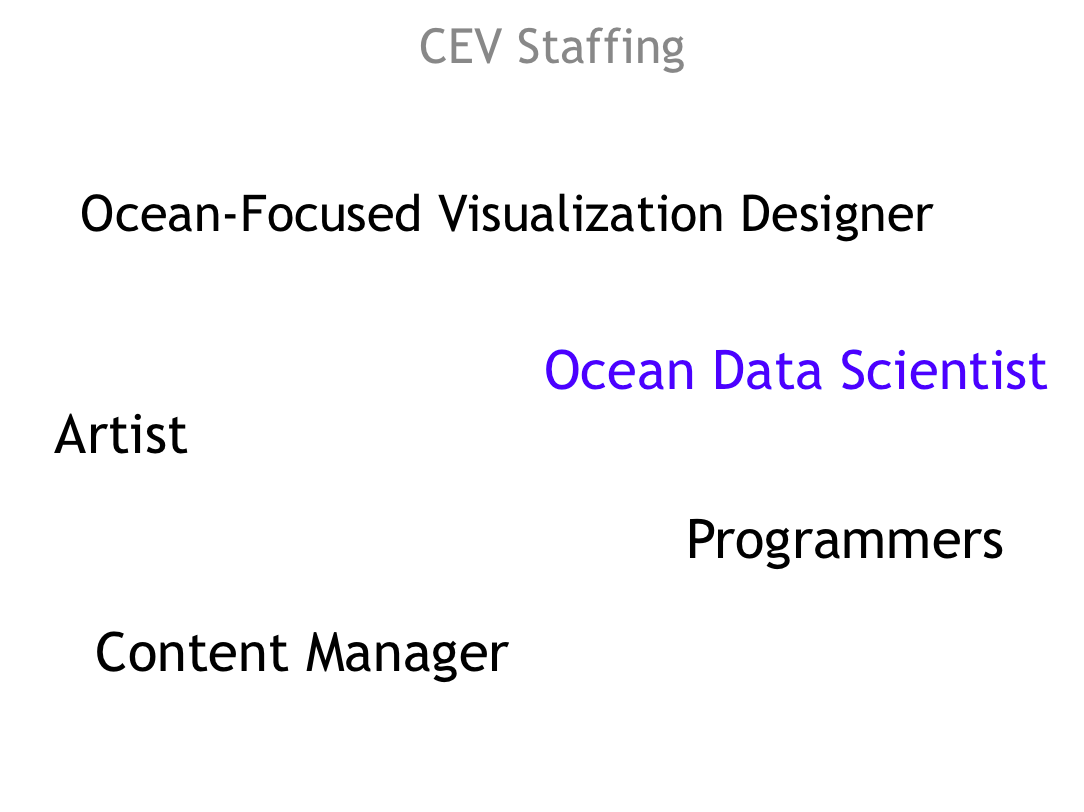
I watched the CEV closely as I seem to watch every collaborative human activity (I sense I have quite a bit of a amateur
anthropologist in me). We clustered the roles needed to be effective as a team into the five roles listed in the image above.
Mark's role first and foremost was as an ocean-focused visualization designer.
Our artist was a trained artist who grew his visual tools and visual design skills to follow that training. He is a tremendous
talent who has grown ocean science specific perspectives over the years. Our work would have suffered dramatically without his
participation although Mark would have put many hours in trying to emulate that skill set.
I joined the team third and realized there was an immediate need for me to become an ocean data scientist to better coordinate
getting our clients' data into our tools in order to run them through a pipeline towards visual product results. My training in
financial analysis and spreadsheet tool use came with immediate relevance and I added on a long list of new ocean data manipulation
skills to build upon that base.
I dabbled at creating a content management system to meet the team's ambition at reusable content and then was able to turn that
role over to a full-time content management collaborator who joined CEV full-time. The capacity to focus on content management
full-time made for a unique advantage on the work results reusability front and currently client's contact the CEV to get their
own content management systems developed for their use.
As mentioned previously, programmers came and went at the CEV as they pursued academic degrees that required areas for them to
practice newfound skills and test out newfound ideas. We all built programming skills out of necessity, with the sole exception
of our artist whose opportunity cost was too high (thankfully, his interest waned on programming tasks as well).
To watch these five roles amass experience, the capacity to deliver results, and the interest in collaborating among a team to
learn together and contemplate together — that was something to see. The process resonated to where it became hard to
imagine having to work in any other way. And yet, all of us had to learn to do so as Mark got sicker and was unable to be his
full collaborative self.
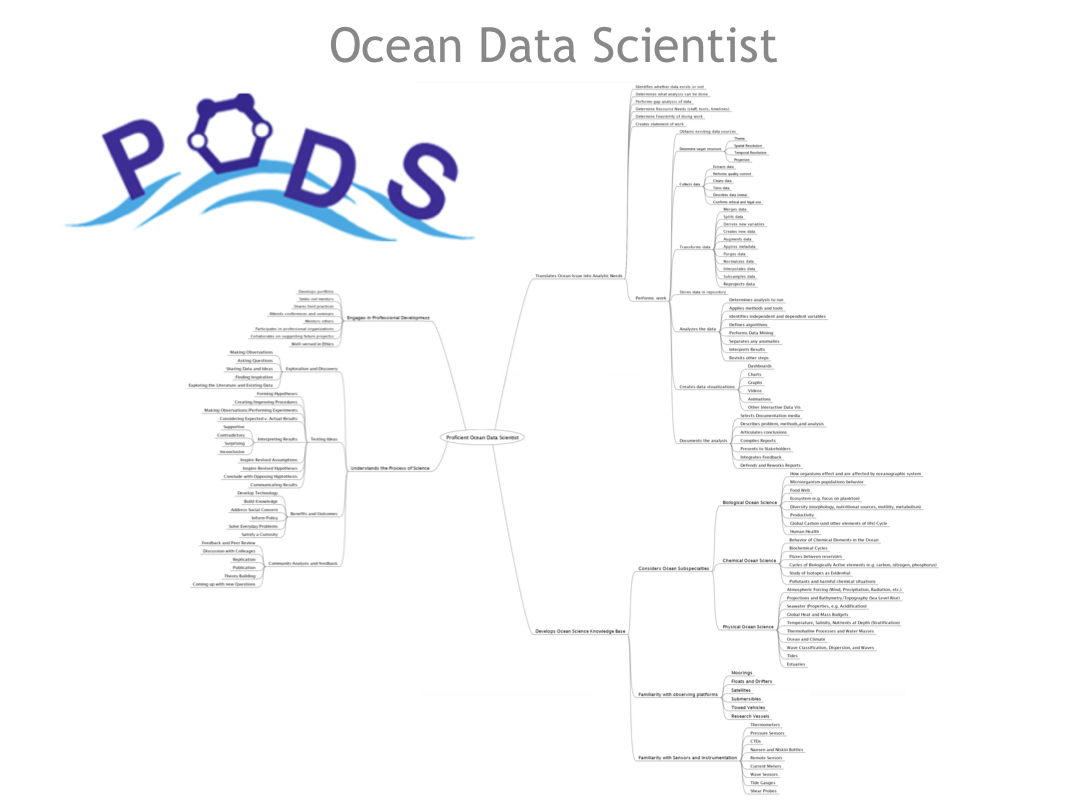 Here at URI I have the pleasure to work with Rob, Chris, and Lucie to build curriculum for a Proficiency in Ocean Data Science
minor. The minor is available for Autumn semester this year. The taxonomy of skills and knowledge bases we believe a PODS
professional should have is shown in the image above. Our job will be to embed the taxonomy into curriculum and student
experiences associated with the PODS minor. When spending time with studying the taxonomy, I can remember specific situations
where I had to learn skills in order to support a CEV client or to help a collaborator support a CEV client.
Here at URI I have the pleasure to work with Rob, Chris, and Lucie to build curriculum for a Proficiency in Ocean Data Science
minor. The minor is available for Autumn semester this year. The taxonomy of skills and knowledge bases we believe a PODS
professional should have is shown in the image above. Our job will be to embed the taxonomy into curriculum and student
experiences associated with the PODS minor. When spending time with studying the taxonomy, I can remember specific situations
where I had to learn skills in order to support a CEV client or to help a collaborator support a CEV client.
 I don't know how many people interrupted Mark's train of thought on a regular basis, but I know I did and there were days when
I felt confident that Mark appreciated my tangential journeys. He told me as much, but of course I do become less confident
when looking back upon those times. There were days when I knew I was risking irritating Mark by bringing up work that was not
within the CEV's sphere of mission. Mark had a great poker face in that it never wavered from the same base smile and patient
countenance.
I don't know how many people interrupted Mark's train of thought on a regular basis, but I know I did and there were days when
I felt confident that Mark appreciated my tangential journeys. He told me as much, but of course I do become less confident
when looking back upon those times. There were days when I knew I was risking irritating Mark by bringing up work that was not
within the CEV's sphere of mission. Mark had a great poker face in that it never wavered from the same base smile and patient
countenance.
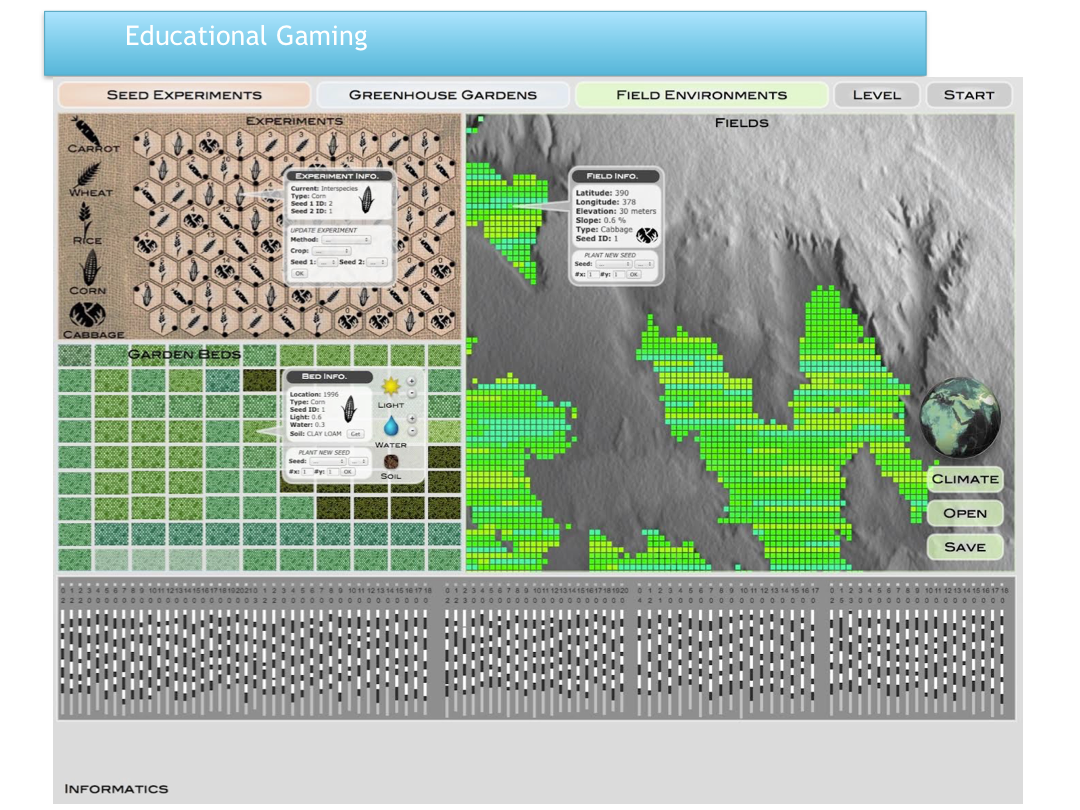
The image above represents the outcome of one such interruption. The Games for Change conference holds a competition every year
to provide a free conference-wide pass to those who propose superior ideas for an game of change (change meaning providing
content of social relevance and conscience that might change the player's behavior). I was able to win such a pass in 2006 and
had been curious of the progress of the conference since then. I showed Mark an iteration of a game I had been working on for
such application. The game was functional enough to demonstrate it's game play but of course Mark found much opportunity to
improve how the game looked and provided feedback to the player. In the course of just 36 hours, Mark came back with the game
interface you see above. I was flabbergasted by his service in my precious role of client. Mark asked all the right questions,
questioned all my assumptions effectively to provide me a deeper awareness, and did a fair amount of mind-reading when it came
to the visual experience I wanted a player to experience. There had been so many wonderful tangential tasks Mark had collaborated
on in our history together when feeling peers in health. And yet, Mark provided me this cherished gift (as a painter might provide
a friend or a poet might provide a friend) when his health was nowhere as vibrant as mine.
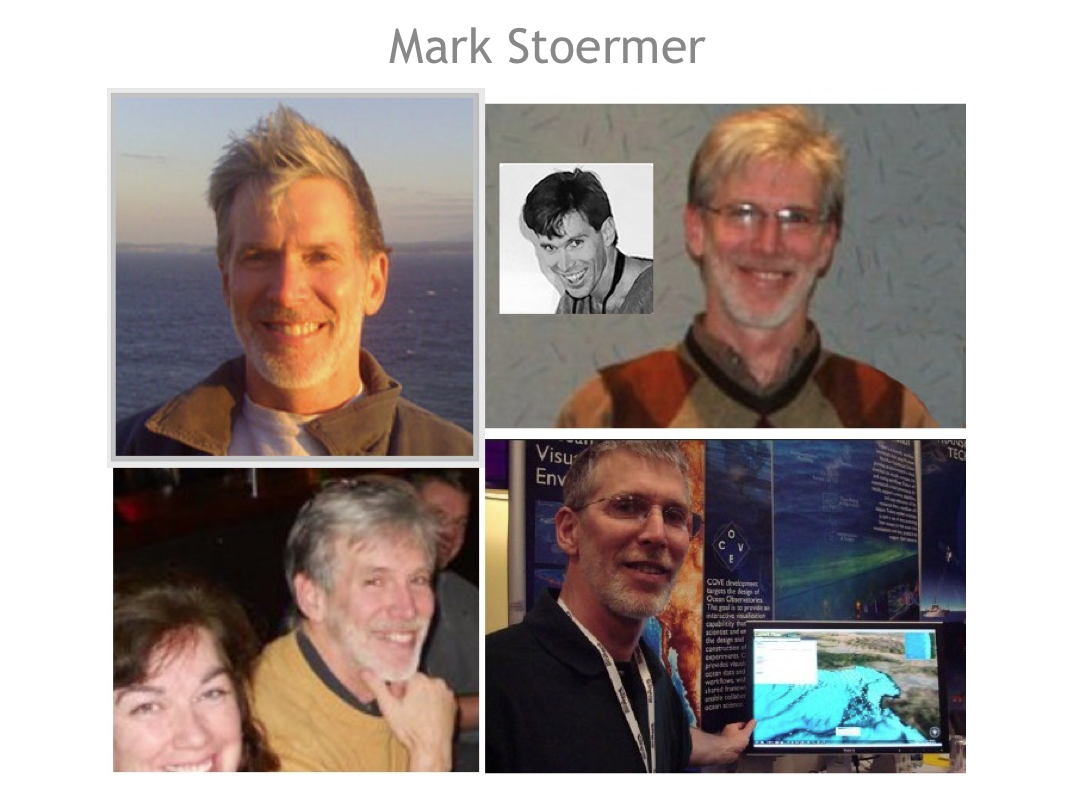
I leave you with this collage of pictures of Mark as I open up for questions. Mark's family gets much joy from the picture in
the upper left (it is one I know Mark enjoyed himself). The black and white thumbnail comes from his childhood family as one they
cherish in representing his boyhood spirit. The picture of Mark in the upper right was taken at my dissertation defense (he looks as
if he were a co-recipient of the honors bestowed, no?), of he and his wife celebrating that defense in the evening in the lower
left, and of Mark as his finest when showing off CEV-created materials at a conference whereby I got to work by his side for a
few glorious days where we could both discuss newfound ideas from the fodder of peers and colleagues. I continue to be in awe
of what he could accomplish as destinations while he made the journey so deeply meaningful moment by moment.
|