The slides can all be experienced via a PowerPoint presentation should you wish to download the presentation in a file.
Visualization Support for Community
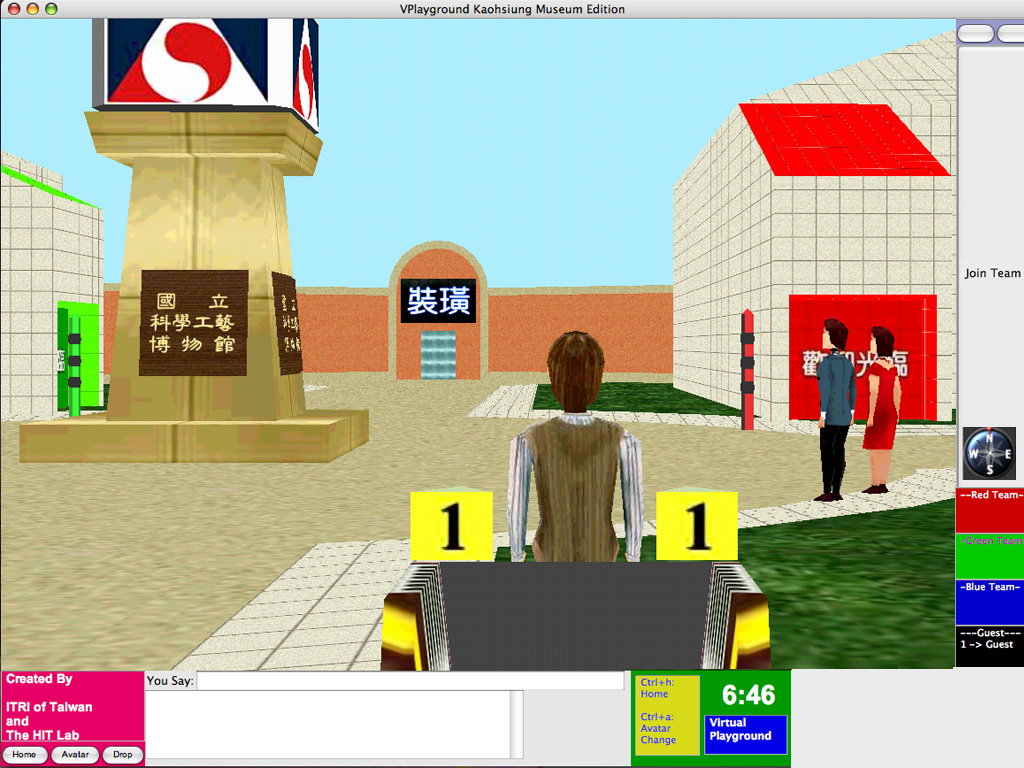
My awakening to using visualization to spark community came when working on a Virtual Playground project at the HIT Lab at the University of Washington in Seattle. The Taiwanese government provided a handsome grant for eight of us to build an online activity that could show the power of on-line graphical environments to foster learning and community engagement. We built a challenging scavenger hunt for Taiwanese students from age 10 to 12 and ran a visualization server from the Kaohsiung Museum of Science and Technology for 22 days. Students downloaded a kit, pointed to an online Web address, and spontaneously joined red, blue, and green teams who worked together to build house furnishings according to understanding the significance of using adjectives as descriptive words. We were shocked at how many kids participated in the thirty minute sessions. The wait queue let us run a session every 40 minutes as there were often fifteen students waiting to experience building cyberspace together. The fact that I could lurk in on their playing sessions from across the Pacific and watch all fifteen kids moving around in 3-D while communicating in foreign-to-me Chinese characters promised a lot to me in terms of bringing the world a little closer together. Our client representative, who spent the time at the museum watching the games being played on the big screen while explaining the benefit of a $100 graphics card, had a great three weeks until an earthquake took out electrical power in the museum for the rest of the month. I experienced the earthquake in real-time by seeing the server shut-down. 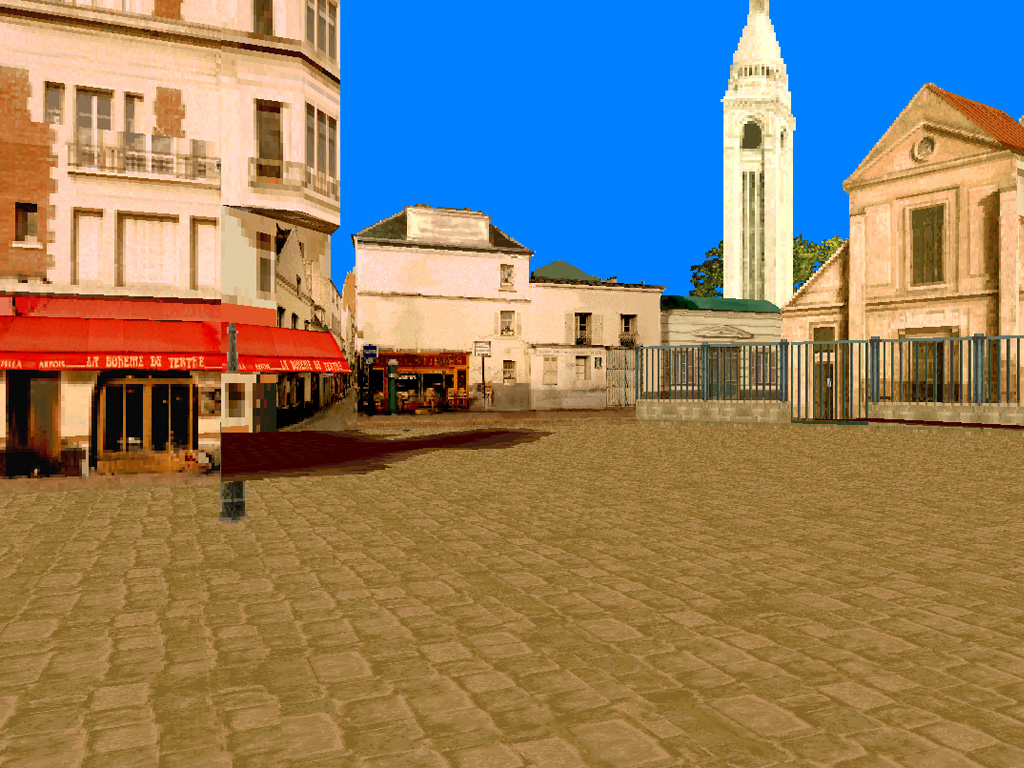
The ability to build 3-D places to explore seemed a very creative and engaging experience for a human being to experience. The fact that a smart and thoughtful group of people created a language with which to do so seemed very hopeful. I attended many meetings of the VRML (Virtual Reality Modeling Language) community and found their heads to be in a great place - supportive of helping everyone experience the world through tools that let us build representations of the places we loved so that others could experience those places from afar. To me. and hundreds of others I got to meet seredipitously on the Web through shared cyberspace building, VRML seemed at least as useful as HTML in providing empowerment to the Web. Example town squares popped up all over the Web - looking similar to this example from the Montmartre neighborhood of Paris. 1995-97 was a very heady three years for us until we blew through all the venture capital at way too fast a clip (we sure got together a lot in physical space without embracing the virtual space as a place to meet). We experienced each other's worlds in isolation but while developing new extensions of VRML that would provide multi-user experiences inside virtual worlds.
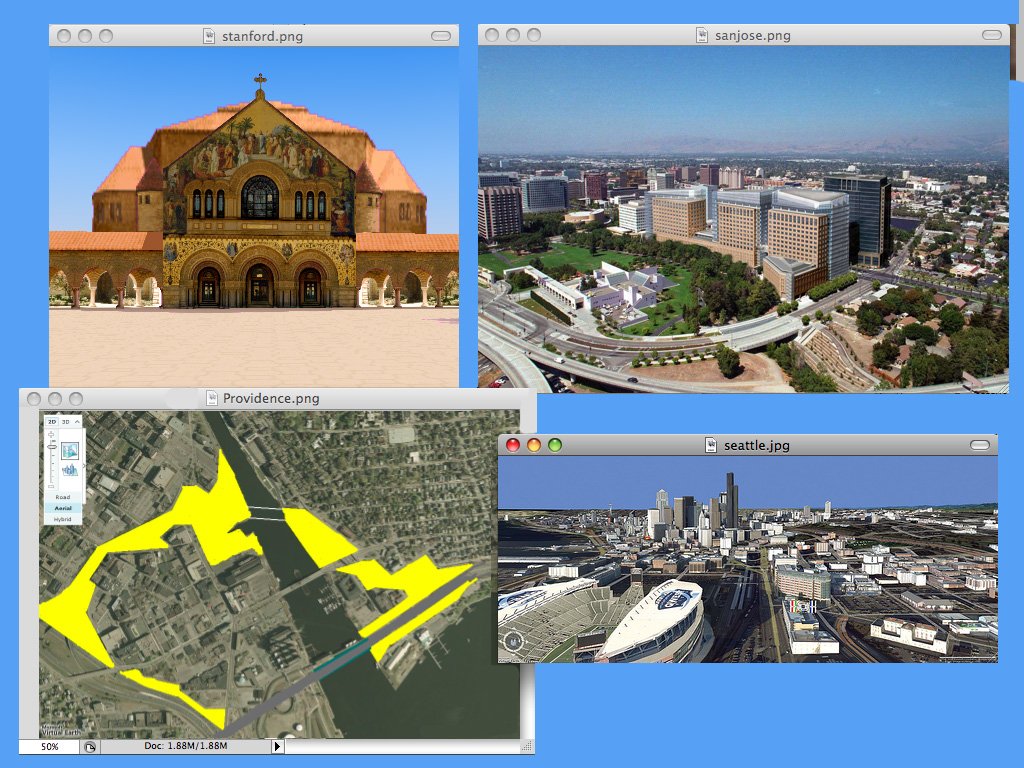
The virtual cities that have appeared on the Web have grown in sophistication but have been developed in isolation by design firms and talented artists. And, yet, they provide great potential for visual thinking in both historical and future study of our urban centers. As soon as I moved to Providence and learned about the I-way project (where we get rid of a nasty interstate stretch that carved up our beautiful city and removed our views of the Bay back in the 1950s), I played with virtual representations of Providence to compare before and after views of the city. In one example, I colored the new acreage made available by the interstate relocation (from the white crossing to the blue crossing of the Providence River) yellow and could immediately see the improvement to the walkability and connection of downtown for upcoming years. Having experienced so many cities on-line had provided me the ability to visually manipulate urban landscapes in my head. Travel hasn't been the same for me since as I can walk around a city while imagining an interactive model of the city on-line that helps me envision what might have been and what might come for the sights I see. Unattractive spaces immediately suggest alternatives from other cities I've manipulated on-line. I start to see our urban landscape as a series of design patterns that aren't necessarily best thought about through spoken language.
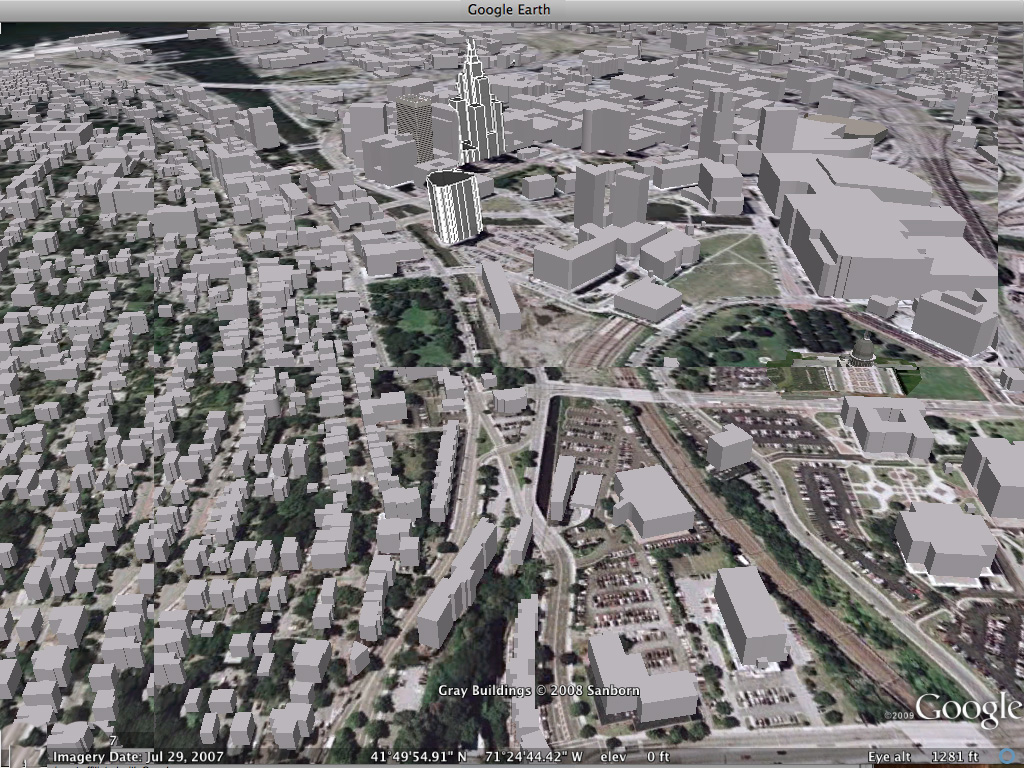
Now, as of 2010, we have three very powerful whole Earth visualization platforms that show great promise in connecting our virtual cities into a continuous landscape that show us the nature of human impact on the planet. We can literally experience the impact of car culture and suburban sprawl in the full magnitude of its impact on our culture by visualizing its magnitude on the planet. The impact is enormous. Us humans can and should be really impressed by the visual extent of our shared works. Virtual tools like Google Earth here let us think in greater spatial extent than the town squares that popped up in isolation in the 1990s on the Web. And, although the visual fidelity can't be rendered photorealistically for the typical home computer (here we see a block rendering of the buildings of Providence where I have exposed the wire frame of two of our more recognizable buildings), the sense of what's to come can get us excited about the significant new tool that is at our finger tips - the virtual globe. We will be able to compare and contrast urban development from around the globe, and with a little humility and thoughfulness for the needs of all our neighbors, look for potential improvements to our local experiences.
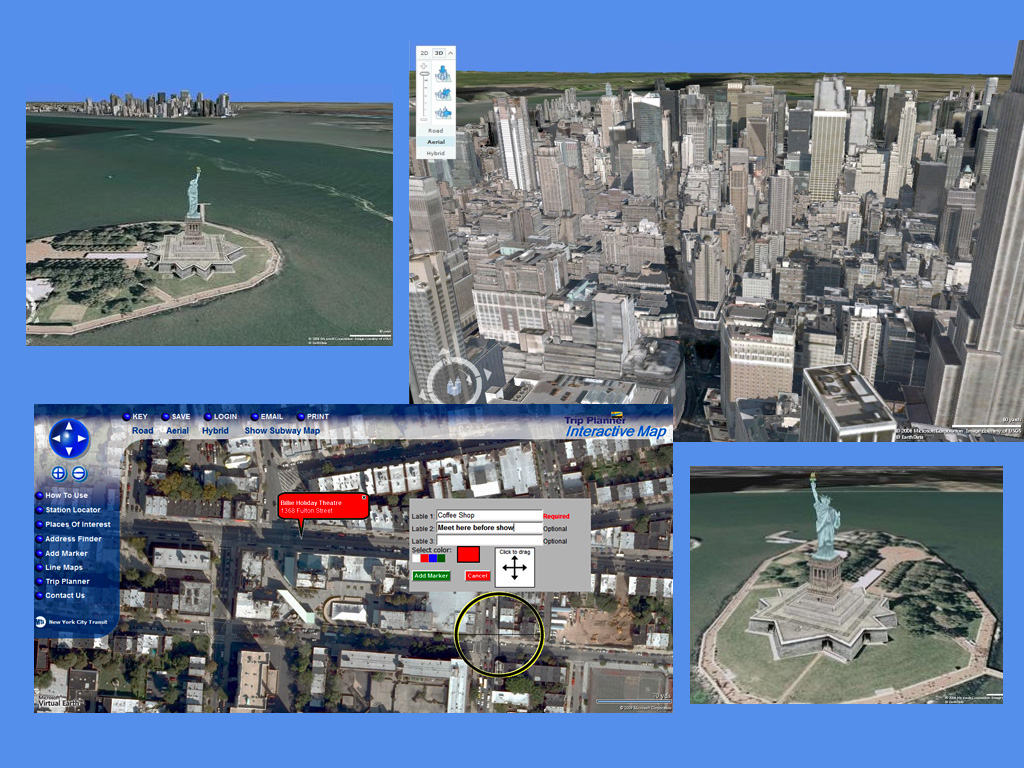
Microsoft's Virtual Earth is bound to be a significant alternative to Google Earth for providing robust commercial sites on the Web for experiencing cities. In terms of efficiency, the Web provides us with many information services from the comfort of our own homes. The potential to maximize that potential is great in virtual cities as well. We can check in on our public transportation to see where the bus or train is currently. We can make restaurant reservations, buy sporting tickets, plan shopping excursions, and plan our meeting points and sitelines for any urban event. If a large Fortune 100 company really gets the vision to use virtual cities for commercialism, Microsoft will deliver a product we can all use to order those products and services we believe will make us happier. Virtual New York is already a fantastic prototype of what's possible for all our world's urban centers in this regard.
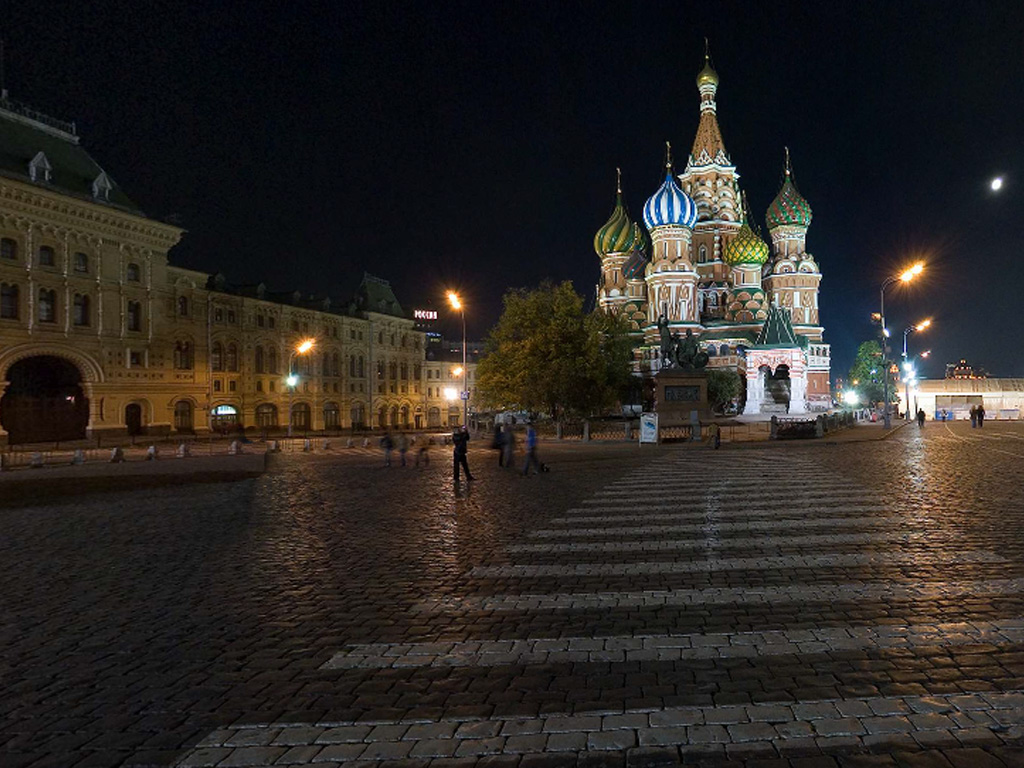
And, thanks to the advancement of digital imagery and multi-core programming environments and hardware, we can sense the experience of virtual cities will be photorealistic for all of us just around the corner. This picture of Red Square in Moscow is available on the Web today as a surround panoramic stitched photograph. Converting it to a walkable 3-D model is not a technological hurdle. Finding demand for such a process to have taken place for our benefit is more the hurdle. We have yet to fully understand what is coming. Just like the pioneers of the spreadsheet tried to tell us we were going to all become better numerical thinkers through their efforts, we espouse the future of a complete virtual globe for thinking globally and acting locally. The spreadsheet took a good twenty years to become a tool we all used to share our ideas about past and future organizational and planetary health. How long will it take us to realize we need to use our virtual globes to mentally connect with our place in the solar system?
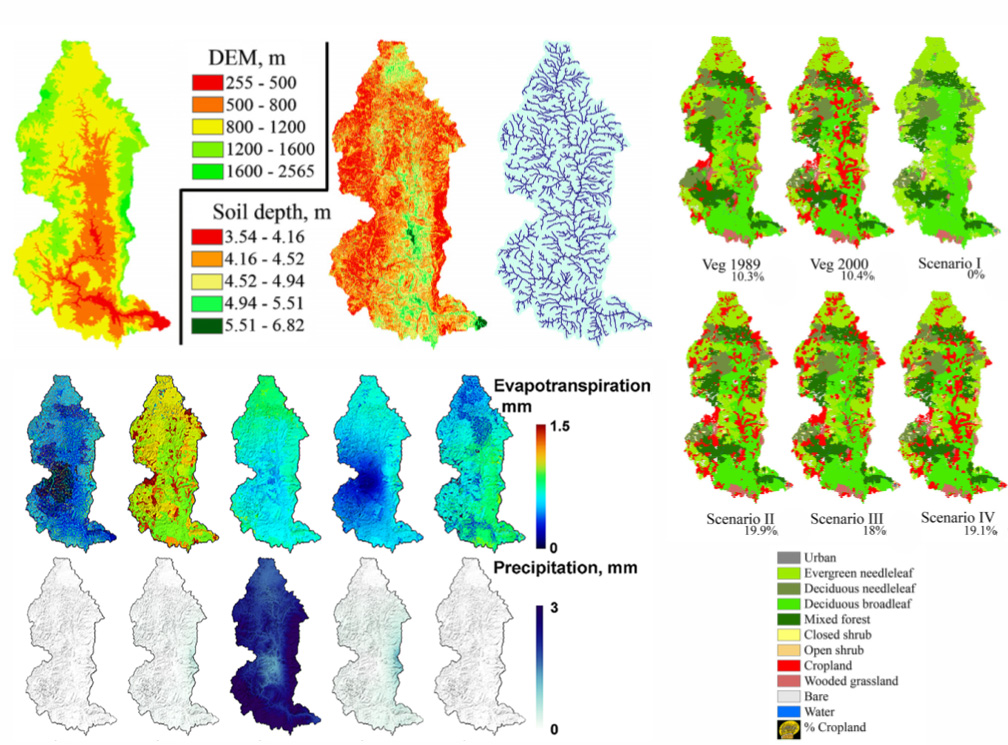
When we consider the history of on-line maps, we realize they came on hot and heavy as a tool for wayfinding through man made roads and buildings. Only recently did Google add a gorgeous terrain map view that gave credence to the landform that existed way before we started our urban design experiments. Naturalists love the terrain view as they plan their hikes, kayak rides, and jogs in local and distant cities they visit in their lives. Google has brought the same respect for the natural world to Google Earth, but the man-made visual layers are just so conveniently available nearby that we are bound to continue to fill our brains with man-made context as we explore the virtual globe. And, those scientists and ecological thinkers will continue to talk to each other in traditional publications using visualizations they can render in their heads through years of experience and formal training. I have helped them do so, such as when the government of Thailand sponsored a study of the Mae Chem watershed for water quality effects of planned development.
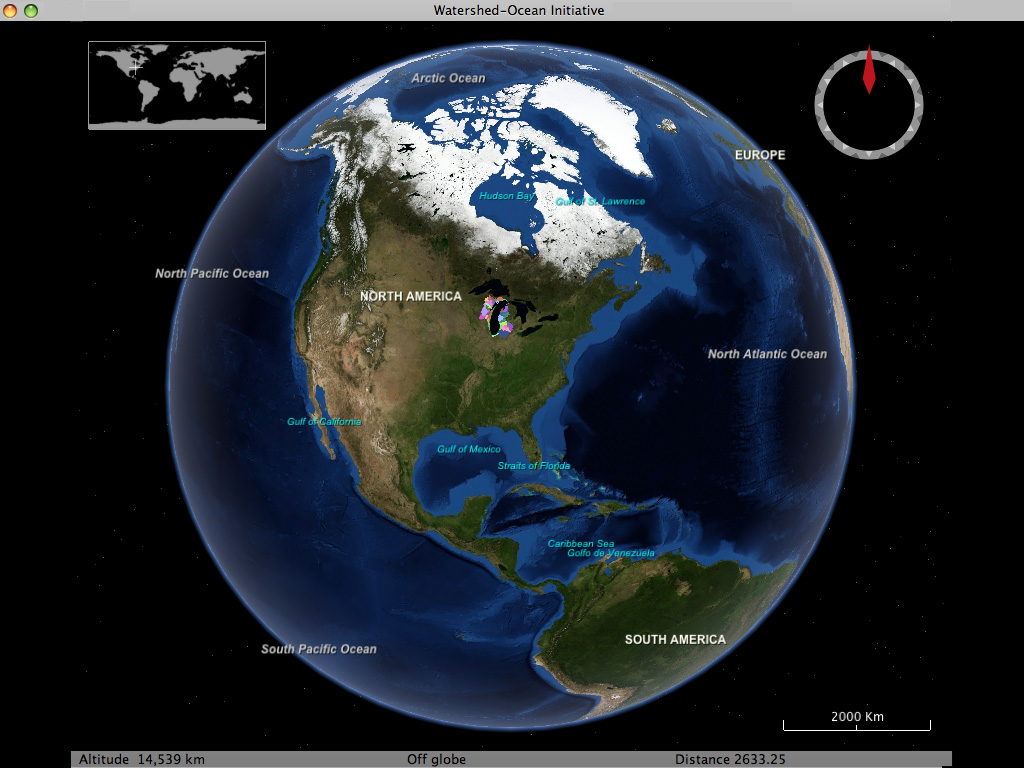
NASA's World Wind virtual globe provides an opportunity to put our natural world up front and center. The Blue Marble dataset seen here shows a composite of satellite pictures stitched together to represent twelve months of snow and ice coverage on average. Seeing the globe without cloud cover is far from natural, but it provides a fair playing field for all locations on Earth to promote their local natural system. Upon NASA's virtual globe, we can redefine the boundaries by which we consider our planet. Natural boundaries like land-water boundaries and watershed boundaries help us better understand how natural resources are shared among our communities. Seeing Lake Michigan environs colored by watershed instead of county lets us consider our eco-address.
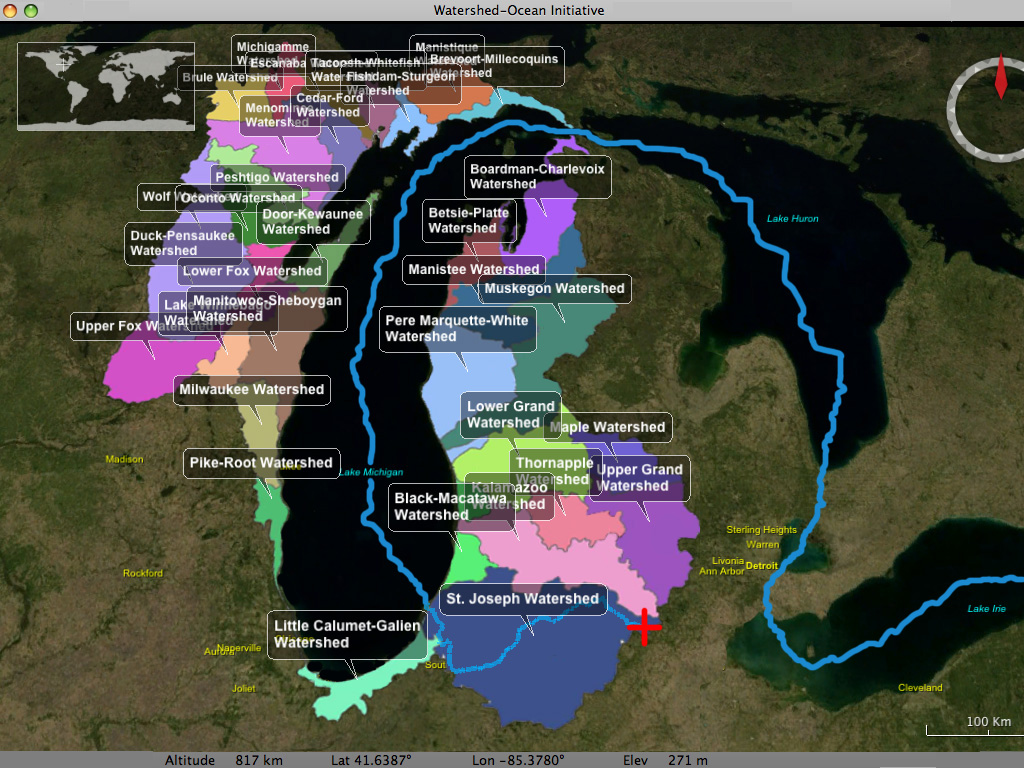
At The Ocean Project, we work to promote watersheds as a natural definition of community through the water shared in that geographic region. We also promote water connectivity through showing the movement of water from watershed to downstream systems and out to sea (where ocean currents can be studied to see how all our water eventually connects us all). Our Watershed-to-Ocean project lets you click on a location within any watershed we've modeled to see how the water naturally drains via surface features (groundwater is another potential layer, but one that is harder to ascertain as it is invisible to the above ground eye). Very few of us can name the watershed we live in and very few of us really know our watershed whereby they can envision the water moving about within it.
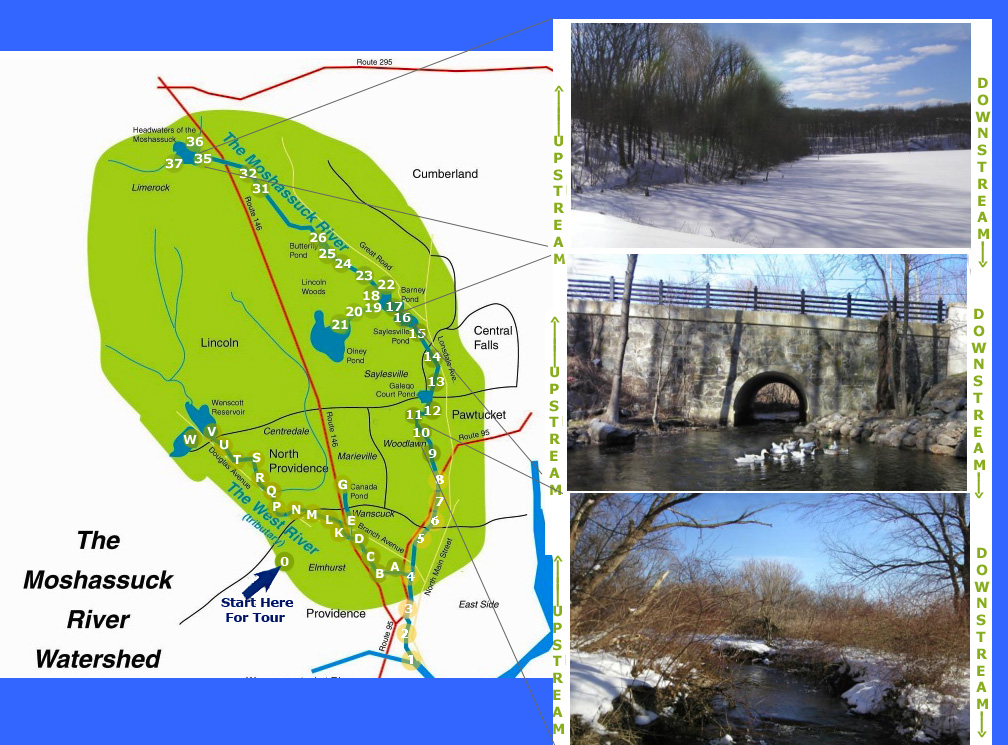
To avoid being a hypocrite, I spent last winter walking all the main tributaries of my home watershed. I live in the Moshassuck River watershed in Providence. I had no idea how beautiful and peaceful an urban river system could be during the winter season. I had the watershed to myself and yet had the privilege of walking much of it with the local watershed council's Director to get to know the history of my Mighty Mo watershed (you start to own it upon spending time with it). Moshassuck means 'place where moose water' in the native American language that was dominant in the watershed for so many years. They are gone as are the moose we assume were quite plentiful. Sitting at different points on the tributaries of the Moshassuck at different points in time with a camera and home-made rotational mount let me contemplate the flowing water - water that has flowed way before I came to be and will flow way after I'm gone. The experience changed me and so I put it all on the Web for others to consider. Walking the rivers is just so different from walking the streets and yet the streets get all the glory in our day-to-day discussion of where we are and where we are going. I look forward to walking all the rivers of the world through a virtual globe some day.
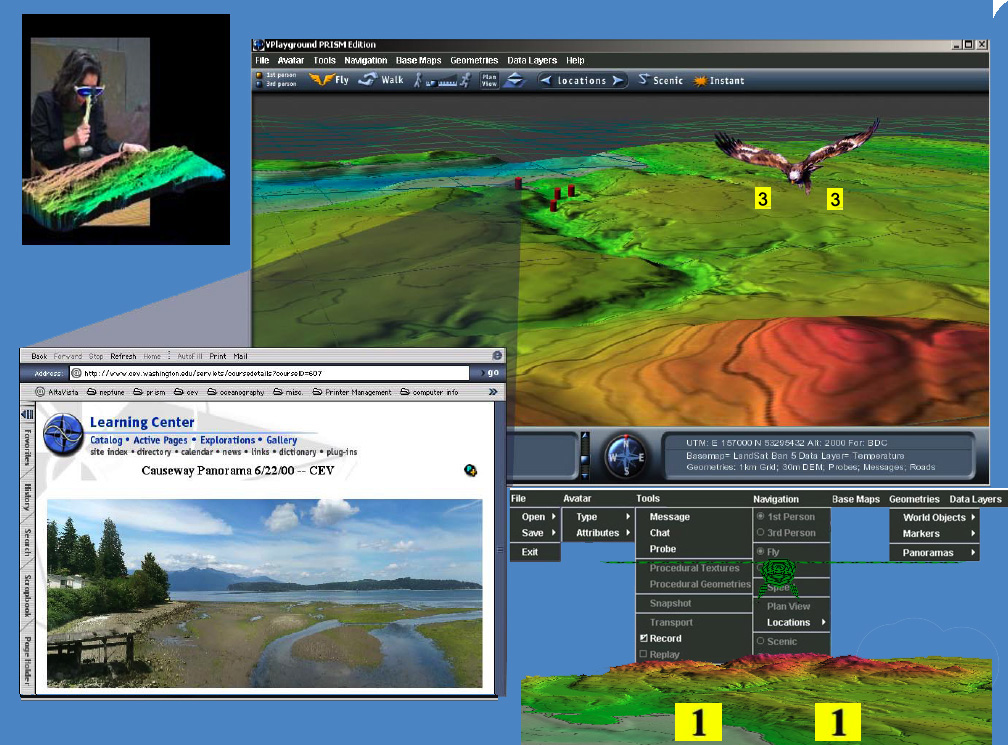
Working on behalf of a National Science Foundation grant. I worked with a design team of four to build a virtual Big Beef Creek application to help first year Masters in Ecology students understand how remote sensing images and remote sensing theory let scientists understand our planet from satellite imagery taken from miles above the ground. We embedded surround panoramic images in a 3-D environment to introduce the watershed to the students that would be doing field study within the watershed's geographic extent. We let half of the class go out and probe the physical world to ascertain information about soil porocity, water table, salinity, and other characteristics of the soil that would suggest potential physical, chemical, and biologicaly function as part of the local ecosystem. The other half of the class had to do their probing virtually to see if they could gain a deeper perspective of the data through interacting with it from different scales and perspectives. They could walk the terrain or fly above it as an eagle would. They could use virtual probing tools to explore key characteristics that reinforced their understanding of remote sensing and ground truthing process. And, they could annotate their probe locations with comments and questions for class teaching assistants to answer. Just watching the class process and seeing the students enjoy the perspective the virtual terrain gave them, taught me much about the world.
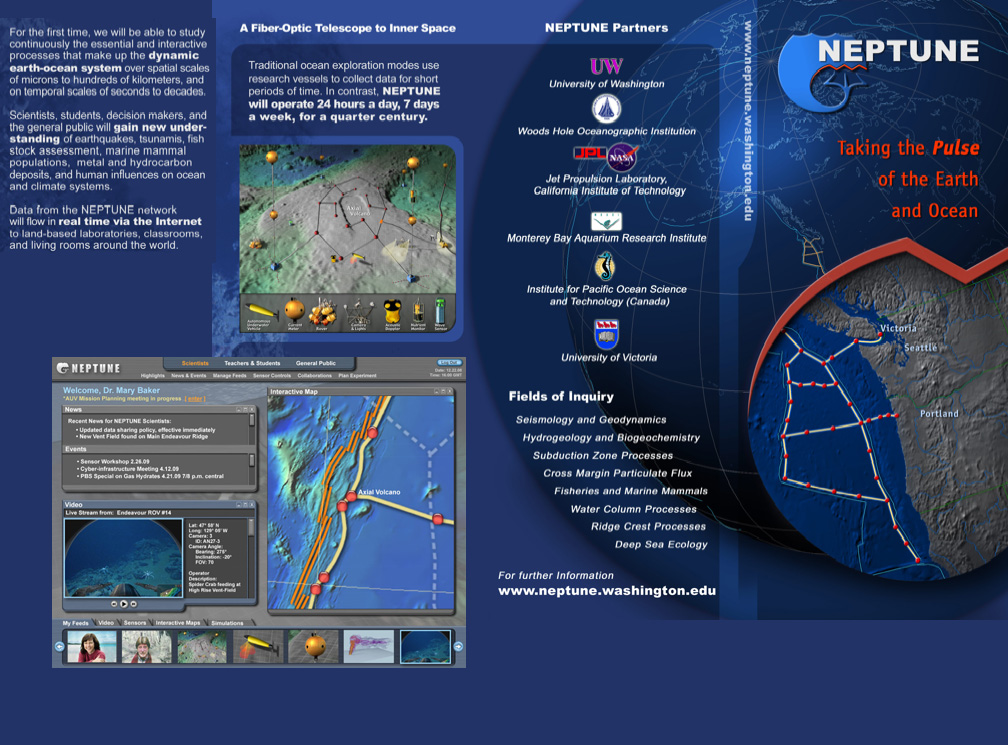
And yet, I could experience Big Beef Creek in person to feel the sun on my face and hear the eagles' flapping wings and feeding mouths. The trick was in connecting my own personal experience such that the virtual BBC could awaken my emotions for the physical BBC. That took some work, but became natural given my motivation in promoting the use of the tools we were developing. Building virtual BBC was as much fun as what I remember experiencing when finger painting in kindergarten. There is something very powerful in enabling others to build their own representations of the world around them. We worked hard to promote our process with other groups on campus that we thought could help us build useful demonstration prototypes. The NEPTUNE project folks were very kind to let us attend their meetings and envision a version of our tool that could exist 1500 meters under the sea for all of us to experience the world down there that NEPTUNE researchers were exploring physically, chemically, and biologically. The Juan de Fuca techtonic plate was not a place I was likely to visit physically in my lifetime. But, I am convinced, I will experience it in full photorealistic, real-time data streams coming from the ocean bottom before my demise (given my odds of avoiding an untimely one).
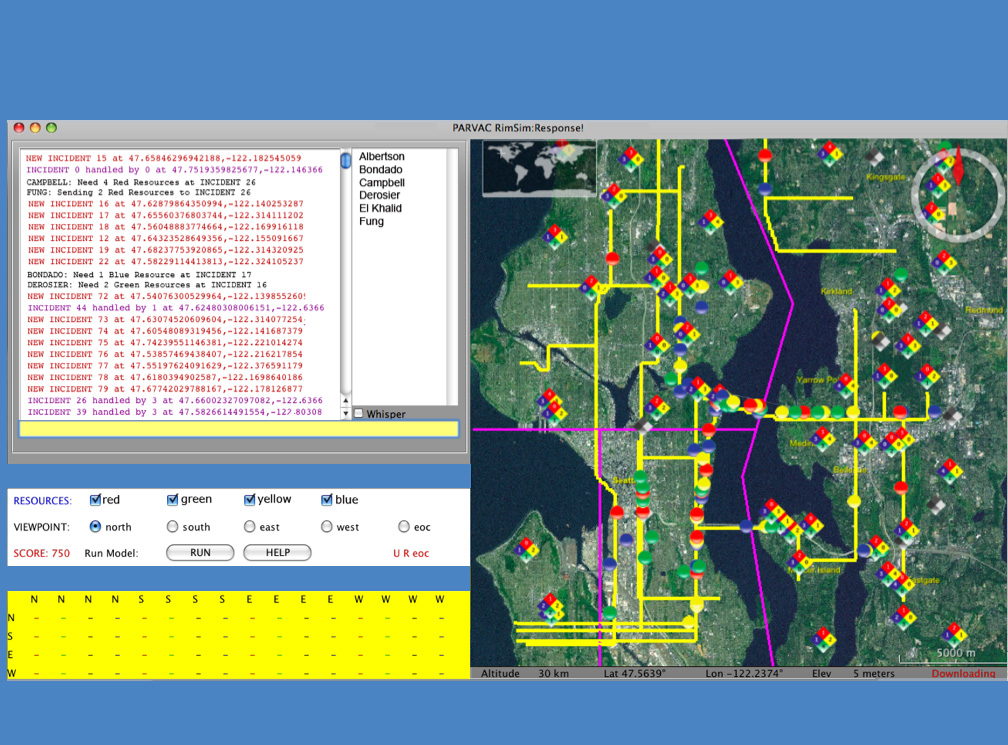
Sometimes to continue a life's work, you have to go with the flow and make your work fit into an emergent model of what the funding stream is supporting. After the man-made and natural disasters of the first six years of the new millenium, money abounded to help communities deal with large-scale disasters. I got involved with emergency response simulation projects taking place on six college campuses in the United States, one of which was the University of Washington. We felt strongly that 3-D models were an important component to emergency response planning tools and got some support from the fire department who would love to know more about the burning buildings they run into on short notice. But, many more people listened to us when we built 2-D tools like the earthquake response simulator shown here. The right half of the tool is the NASA World Wind virtual globe, but zoomed in to frame downtown Seattle. We focused on Seattle-based scenrios and yet built our simulator to be maintained apart from the visualization. We can drive a 3-D version when the time comes.
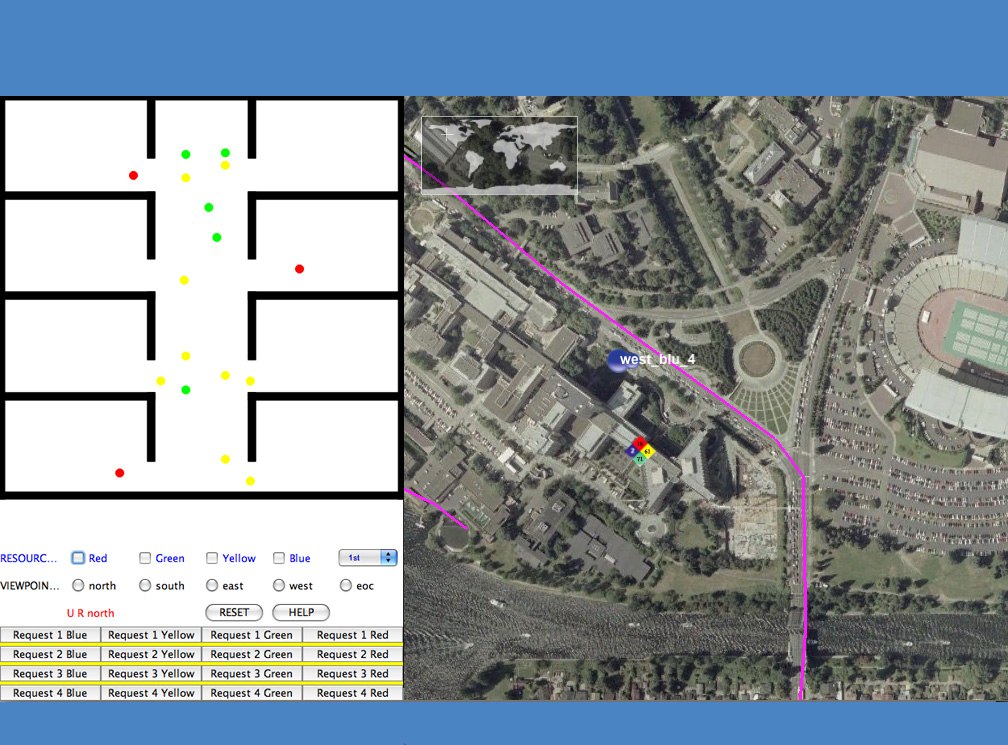
Our simulator demonstrated use to specific clients such as a hospital that needs to become better at evacuation drills. The virtual globe gives them the ability to focus on their institution at any point while zooming out to check on others at any point during a simulation. We built traditional floor plans of the hospital (fictionalized here) and tracked time and motion studies for patient evacuations based on patient mobility and critical care characteristics. We tapped into the road network to facilititate visualizing vehicular movement for those engaged in transporting patients. We began to build in specialized role-playing interfaces that could connect different simulation game players to the simulation model in order to help them anticipate their role and think through potential scenarios that might become obstacles to their effectiveness.
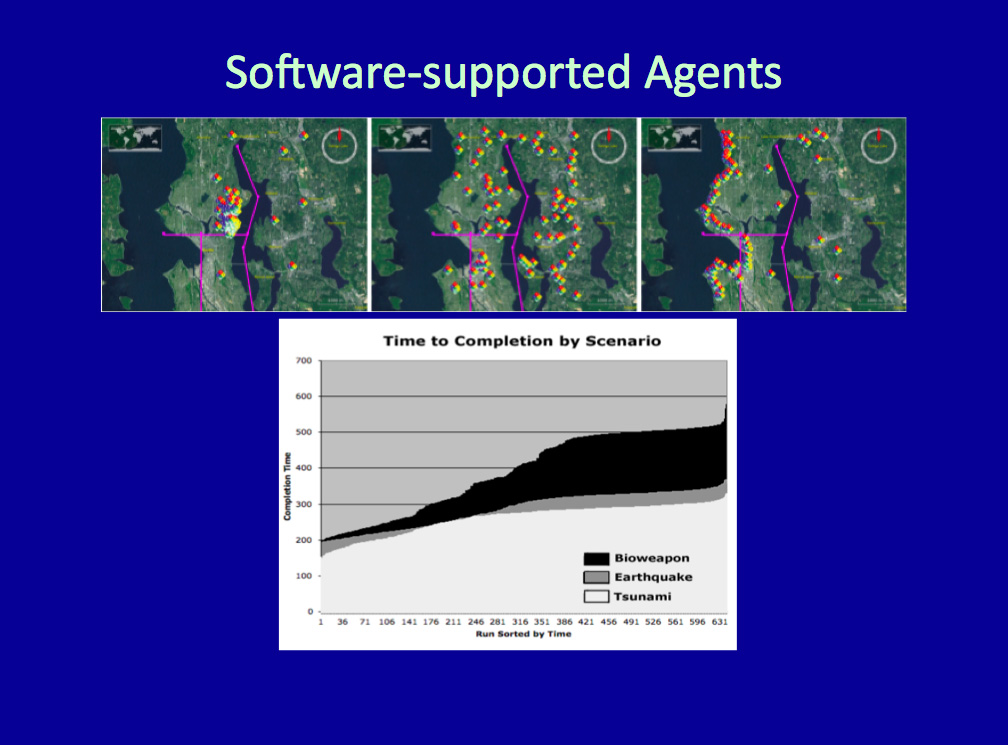
With the inclusion of a repeated statistical evaluation process called Monte Carlo smulation, we were able to publish some preliminary results on how community-wide emergency response simulators could help everyone in the community consider the likely process by which services are distributed and fulfilled for different scenarios of interest. We could do time and motion studies to give feedback as to how long the response effort might take until a certain desired equilibrium could be reached. We had the kind of paper scientific journals are interested in, and yet while writing our results up, I found myself spending much time thinking about all the community-wide processes that could be simulated and envisioned for public benefit - not least of which would be the movement of water associated with knowing one's watershed.
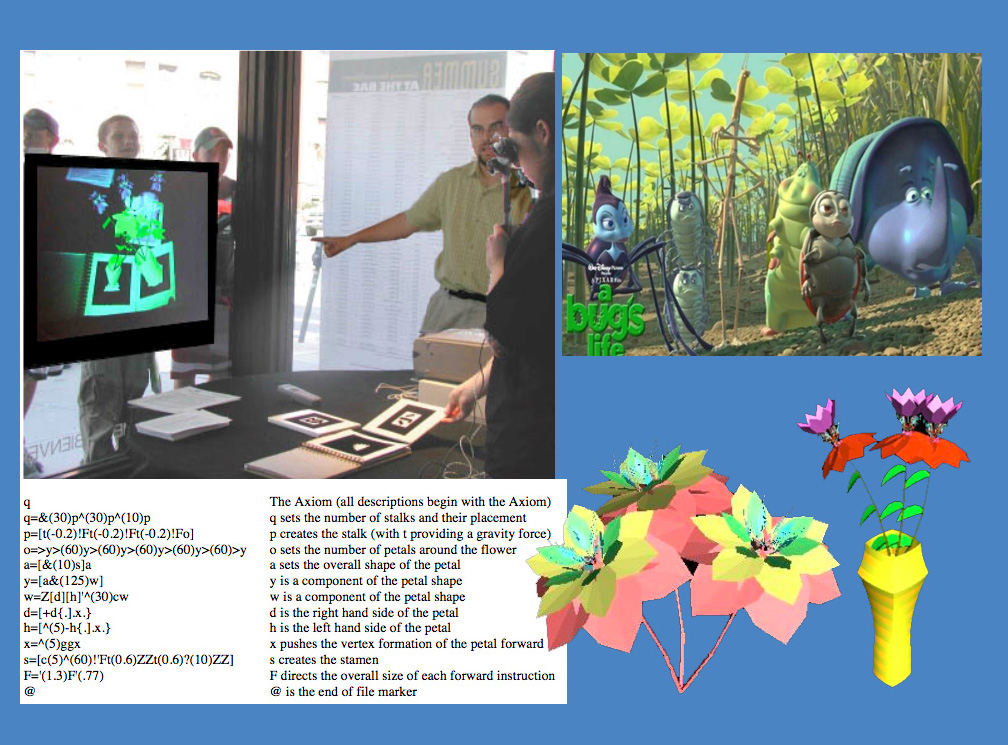
Modeling the natural world into a rich visual environment is something many advanced visualization experts attempt to do. Their methods are fascinating and brilliant in terms of getting a lot visualized with little computing power. I got the gist of that potential through the application of Lindenmeyer systems (L-Systems) to virtual plant design. I presented a virtual plant mating exhibit at the 2001 Boston Cyberfest Festival and traveled to workshops provided by a very dedicated and yet approachable practitioner at the University of Calgary. The tricks of the trade in procedural 3-D modeling development have driven the efforts of many a virtual set designer for animated movie making. Even virtual people have been developed using developmental modeling procedures such as the residents of Whoville in the How the Grinch Stole Christmas full length movie version of 1990. Knowing the quality of the developers behind the virtual environment movement, I can only imagine what they've been able to do with simulated plant growth in a decade's time.
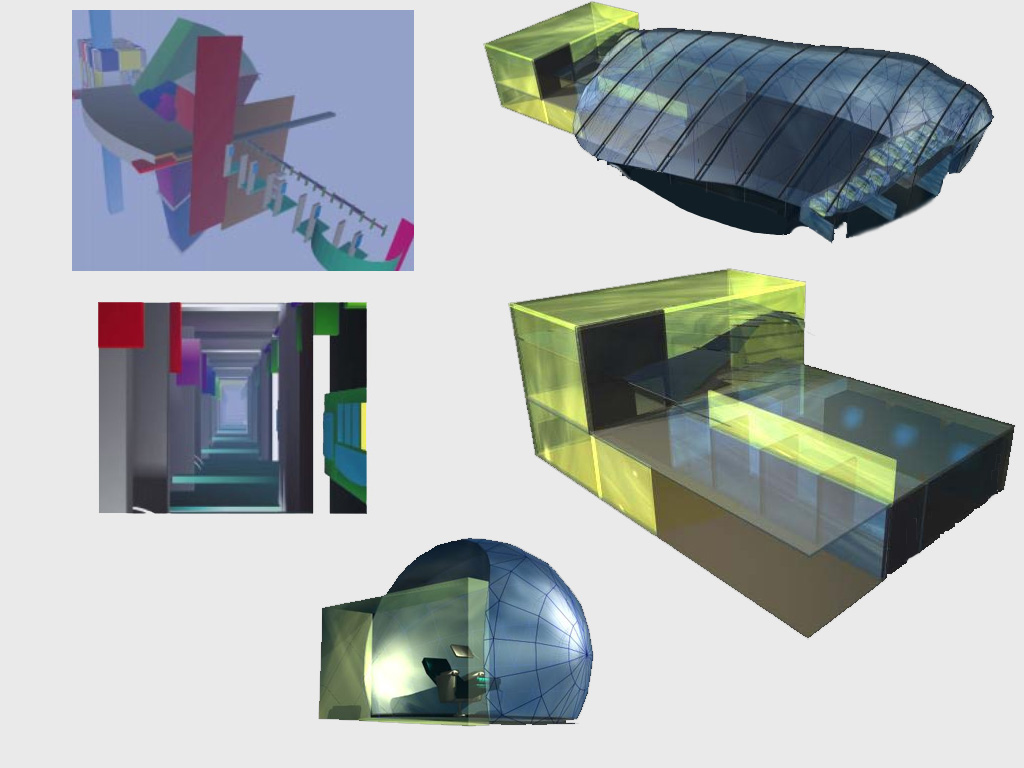
It must be mentioned that the benefits of a virtual reality might not lay in simulating the physical world. We can already experience the physical world with our given senses through locomoting within that world. The information age suggests we might have new informational representations that could help us think in new ways that overcome our imprinting on our six-foot, hundred year, human physical scale. Information structures that information scientists and information architects design need not be realized in physical bricks and mortar for us to experience them. The virtual reality hype of the 1990s showed us many designs of comfortable augmenting tools for experiencing the virtual as if it were physical. The global competition on design and materials evolution will make virtual worlds available to us in surprising ways. Here, we see the ultimate virtual recliner that lets you sit in comfort and augment your life experience with synthetic inputs to your senses. The neurologists are finding that our brains will consider synthetic sensory experiences similar to non-synthetic ones. But, we have a lot of physiological crafting to do before each of us responds well to such an experience. The tools must be adaptable to our unique physiology and existing brain processes in order to convince us we are thinking about something that is real, but just not physical.
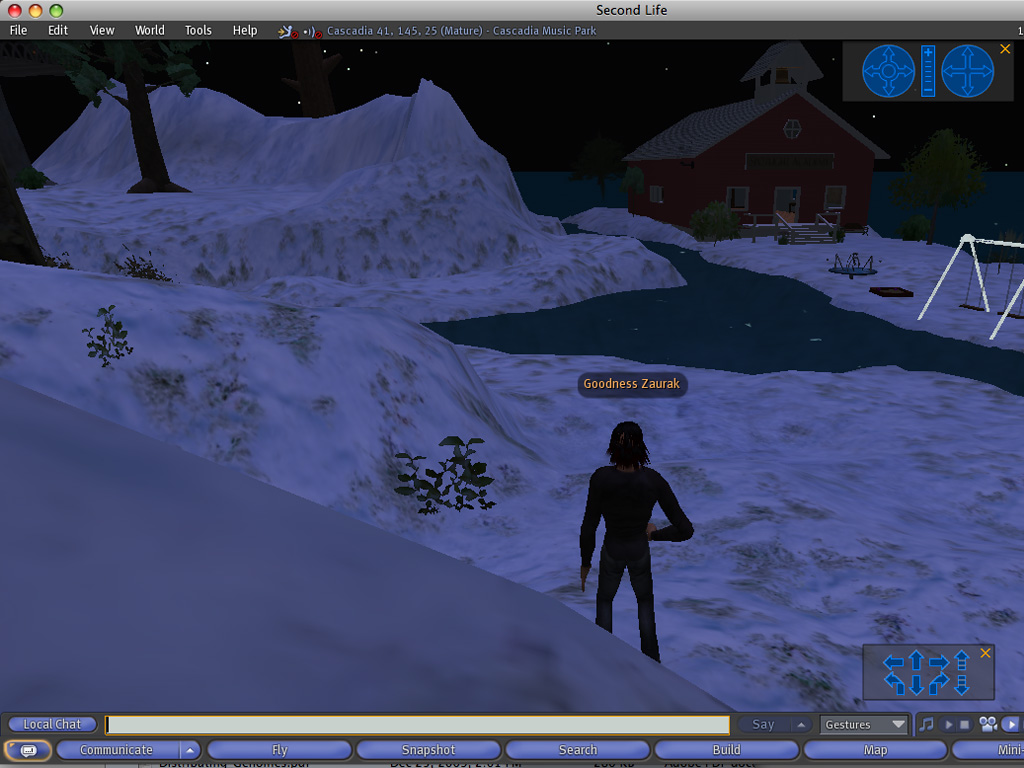
Today you can start to get a sense of the interfaces that might let you experience the virtual globe at ground level and via flight. Second Life is a platform you can download, install, and walk/fly around in on your home computer. It is built specifically for accessiblity for basic computers and so you can play with the interaction techniques without limiting your vision to the coarse visuals available today. And, you can certainly find many cyberspace zealots on-line who can pull at your inquiry to see their enlightened view of all that is possible in a connected 3-D cyberspace. You just might not want to spend as much time as they do in there. I get in, practice my ability to communicate and think in there, and then get out. Regularly. It helps me see the virtual world as potential as I walk about in the physical. I like rendering both in my head simultaneously. I wish everyone could experience the same thrill of dual-rendering as it is such a pleasure and no longer distracting to my life now that I have found my healthy equilibrium. 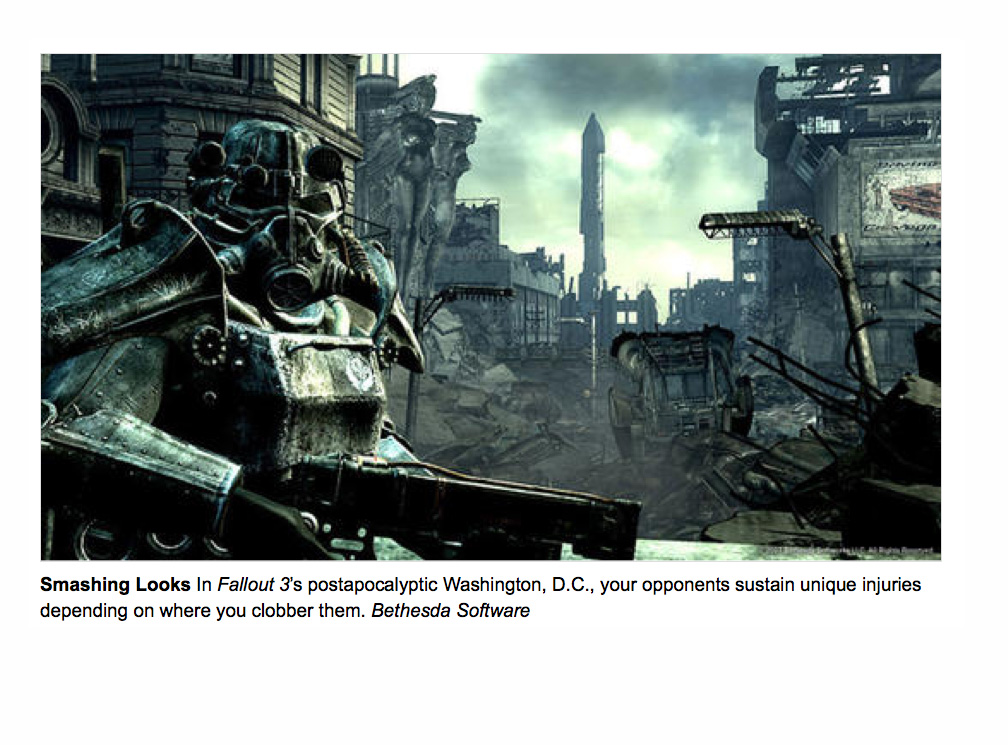
Video games are a place where many of our younger citizens gain perspective on the power of virtual expression for building thought experiences. The realism in the games helps me envision where we will be shortly in terms of what's possible in virtual exploration tools like virtual globes or second lifes. I hope we can get together to use these tools to improve humanity through visual consensus on our priorities to each other and all around life on this planet - and not just take out our frustrations with virtual violence. Thinking about the potential for positive community thinking is as enjoyable as thinking about any utopian society you could imagine yourself living in. Visualization helps premiere athletes play their chosen sports better. Visualization should be a strong tool in helping us co-exist better. It sure could help us help Haiti today, for example.
Flight simulators are another place young people and adults can experience what's possible for virtual spaces. They have cured more than a few people of fear of flying phobias. They have given power to those who want to sense piloting a modern day airplane or imagine life with wings. They have propogated from enabling their users to imagine a life less constrained and full of reach. They promote reduced carbon load through virtual travel in a very explicit manner. Learning to fly in our heads just might help us connect with each other and learn from each other. Virtual presentation has a lot of promise, but is worthy of exploration just for exercising the brain and searching out new ways to augment our thoughts.
|