

Class on May 6 2019
Production, presentation, and dissemination
Analyses done via the data visualization pipeline can be readily shared via the Web, which has a competent programming language (JavaScript) for providing a nice interactive interface and many facilities in HTML and CSS for organizing the experience and attending to desired aethetics.HTML has an IFRAME element which helps coordinate the presentation of analyses created through varying methods (or through multiple individuals or groups).
The IFRAME uses a URL to place content from another source into a skinnable display block on an HTML document. Consider this example that follows as it presents the home page for the COVE software we experienced last week in class:
<!DOCTYPE html>
<html lang="en">
<head>
    <meta charset="utf-8" />
    <title>Exploration of an IFrame Element</title>
    <style>
        #wrap { width: 596px; height: 638px; padding: 0; overflow: hidden; }
        #frame { width: 1000px; height: 638px; border: 1px solid black;
        margin-left:-2px;margin-top:-53px}
        #frame {
            transform: scale(0.60);
            transform-origin: 0 0;
            -webkit-transform: scale(0.60);
            -webkit-transform-origin: 0 0;
        }
    </style>
</head>
<body>
    <article>
        <h1>The Ephemeral Blue Marble</h1>
        <p>I am continually <em>amazed</em> at the beautiful world we live in...
    </article>
    <div id="wrap">
    <iframe src="http://cove.ocean.washington.edu/"
    id="frame" frameborder="0" scrolling="no">
    This is content to show when the link is either broken or the browser can't
    do iframes.
    </iframe>
    </div>
</body>
</html>
The CSS-compliant style sheet uses a frame element and its wrapper (the wrap element) which have both been identified through ID attributes with those named values. Once set up in CSS
code, the elements can use various style declarations to manipulate how the display block is presented within an overall presentation.
Copy and paste the HTML code (with internal style sheet) above into a text document, save it with the name iframe.html, and open it in a Web browser. You'll see:
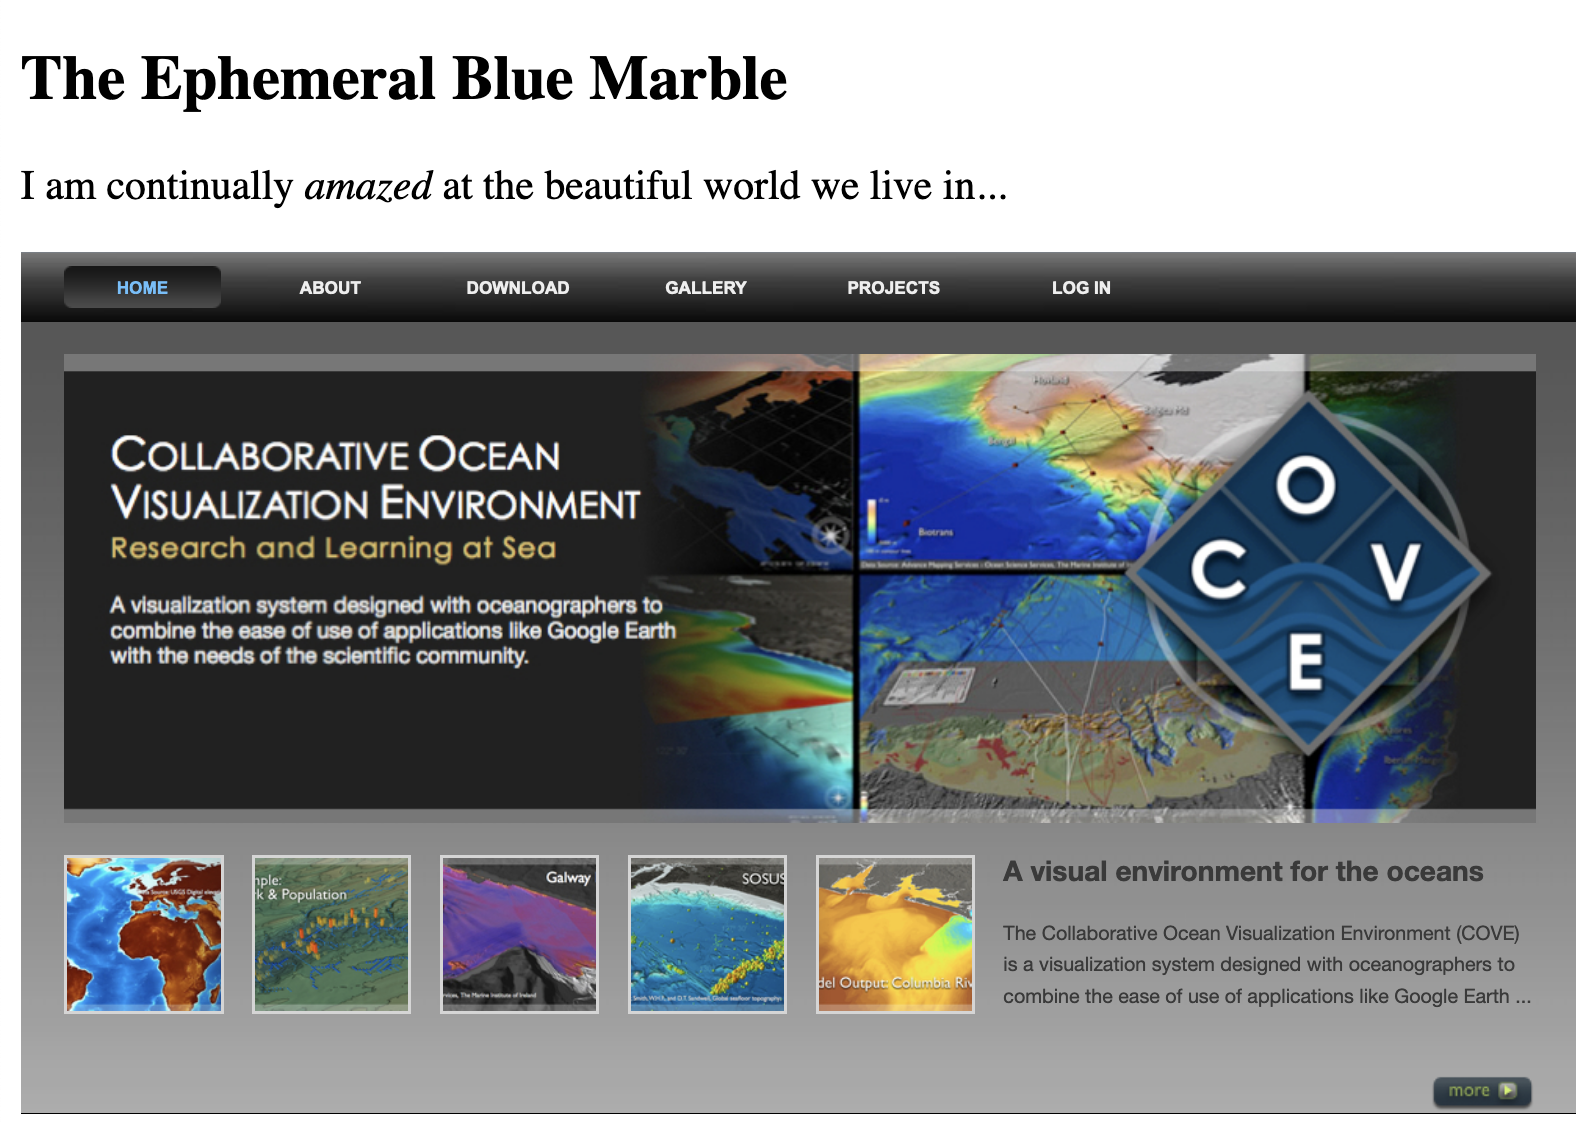
which has a very simple skin of a heading and tagline (the skin can be as elaborate as you want without affecting the IFRAME).
Because of the popularity of the Web for dissemination and the popularity of visual products, most visualization approaches provide immediate HTML output either by using JavaScript as the coordinating language of visualization or by providing an output methodology to get from another form of production to an HTML output.
For example, the Bokeh visualization package provides an output_file() method to take a current figure from Python development and export the figure to HTML (with its own simple interactive tool menu):
output_file("data/gas_index.html", title="CO2 Index by Continent")
The export process exports the whole visualization as a JSON document that can reconstruct the visualization in conjunction with a valid Bokeh JavaScript library like bokeh-1.0.4.js:
<script type="application/json" id="6965">
    {"f20acfd3-a014-48da-958d-a3eb5197da82":{"roots":{
       "references":[{
           "attributes":{
               "line_alpha":0.1,"line_color":"#1f77b4",
[...]
<:/script>
and as usual, JSON encapsulated content can create long, yet efficient, files.
Consider this student's climate change analysis page from within her project submission:
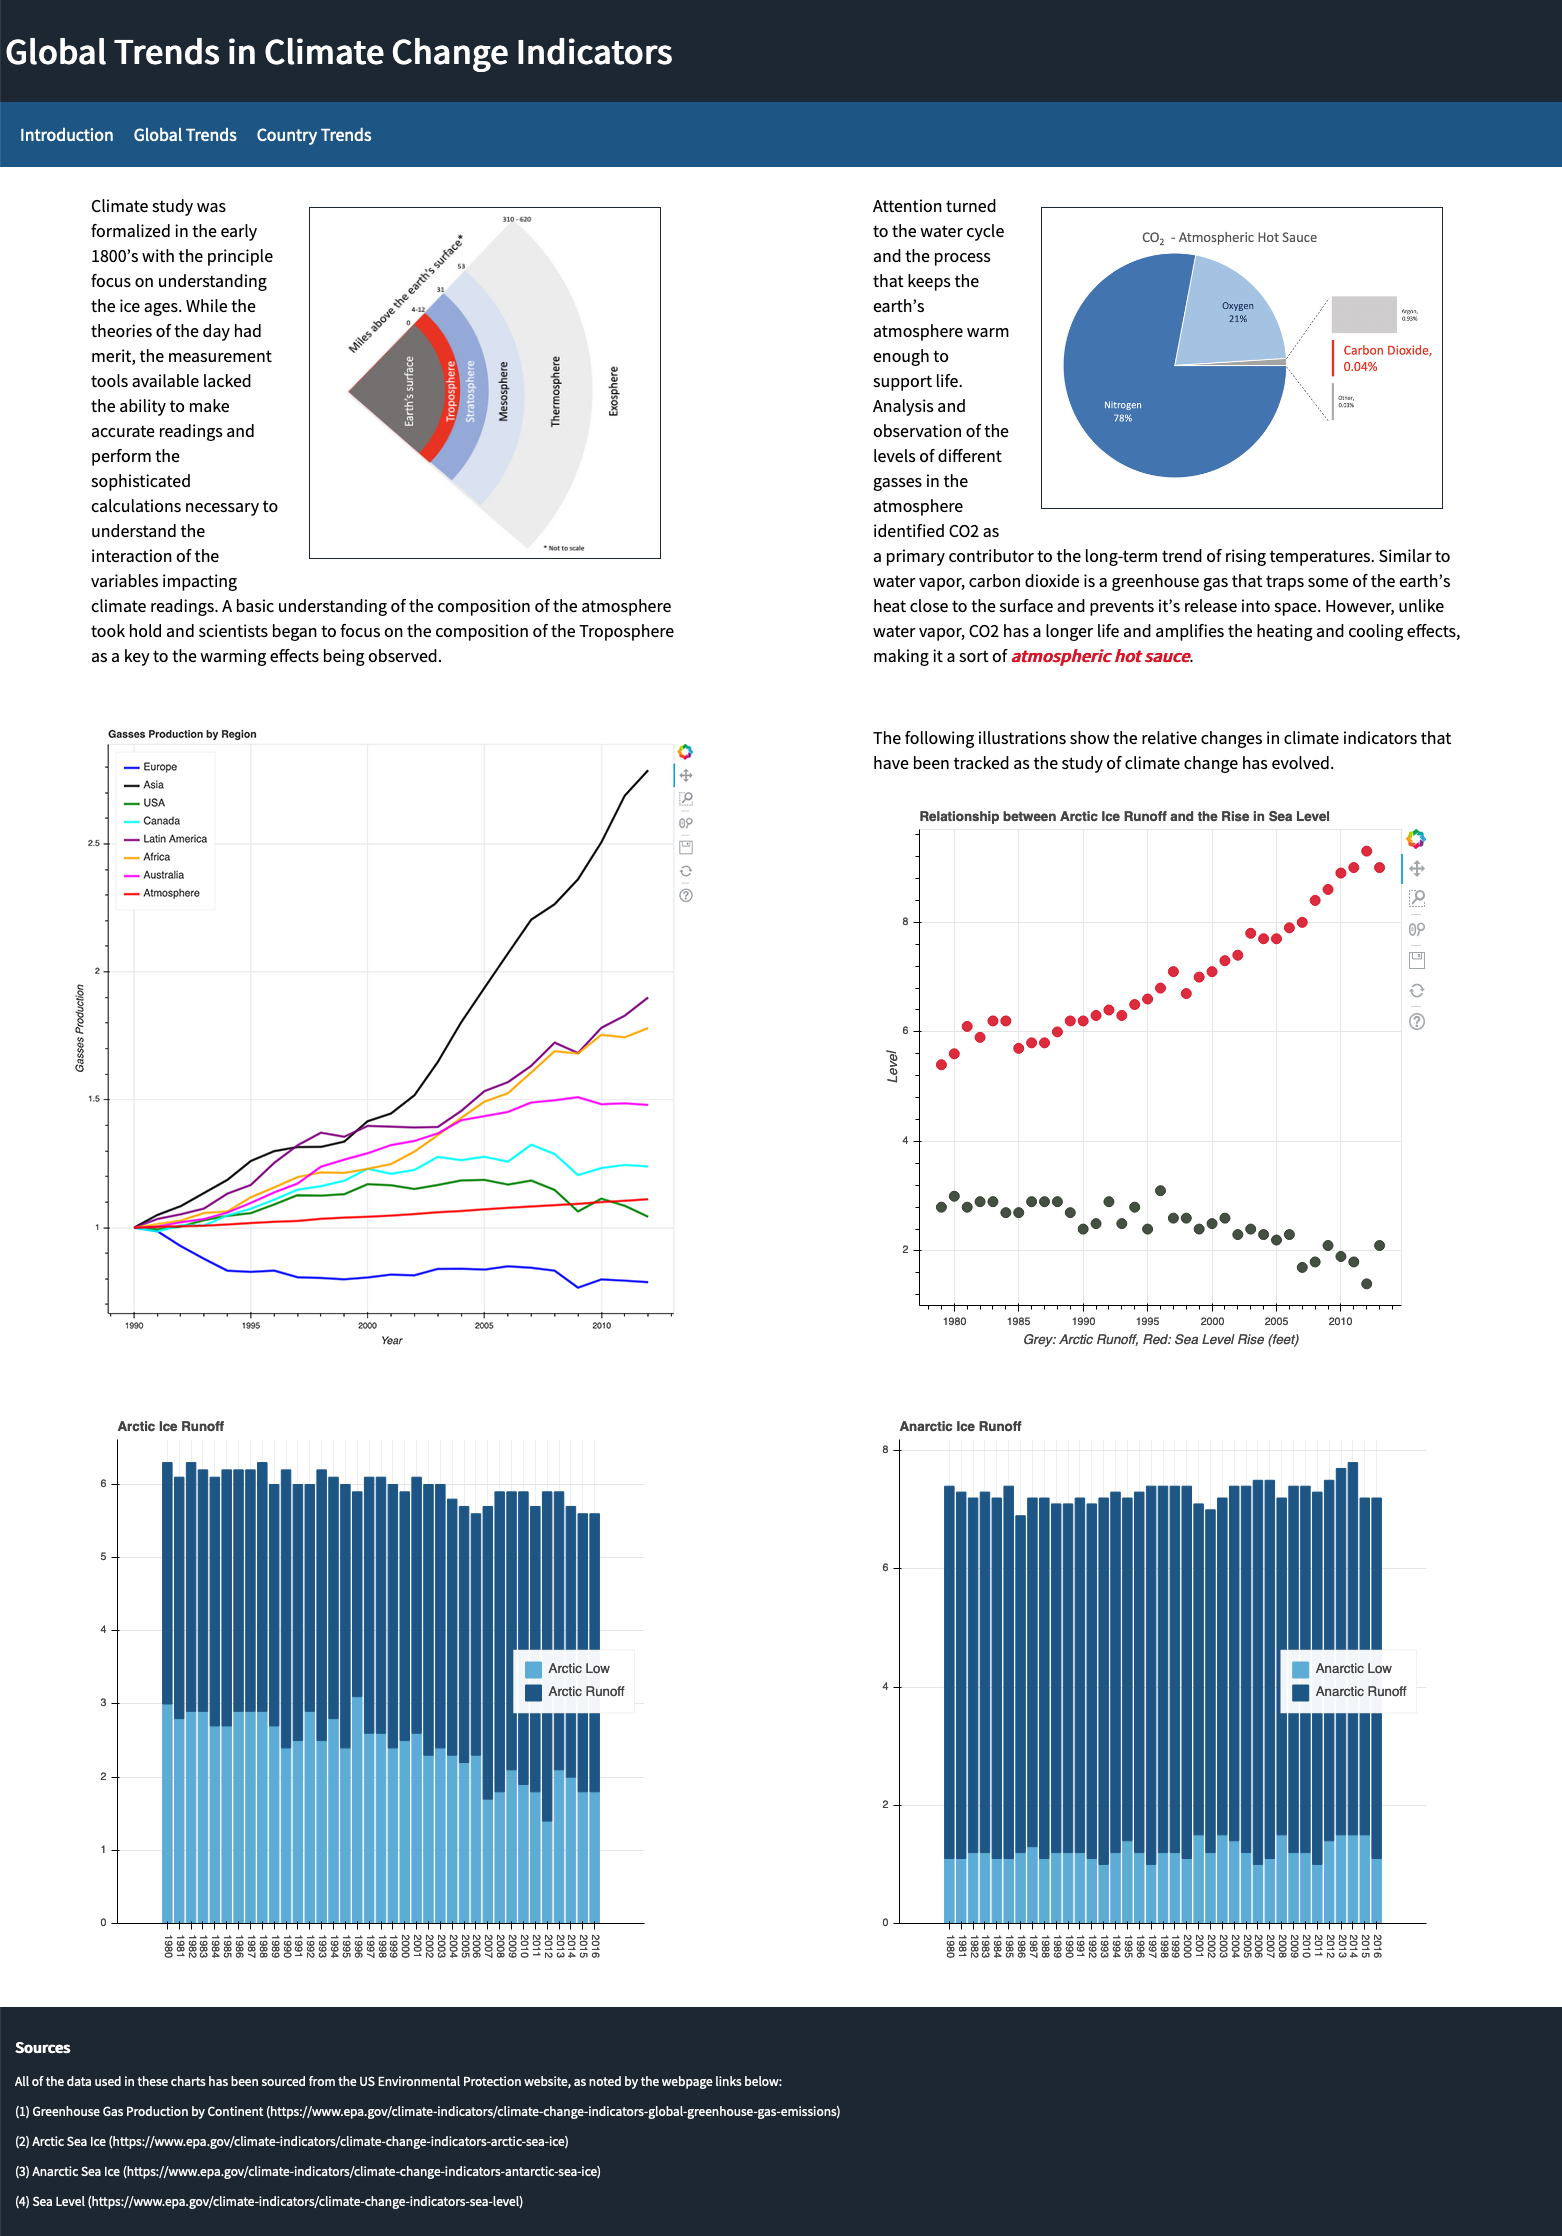
For this presentation, the student used a skin that includes the two images at the top, and four IFRAME elements to present four of her dynamic visualization outputs on the same HTML document. The list of sources is also part of the skin, provided via text and style sheet declarations.