

Class on March 27 2019
Students looked at global environmental data from 1880 to 2018 and considered some
correlations between the variables.
The data comes from:
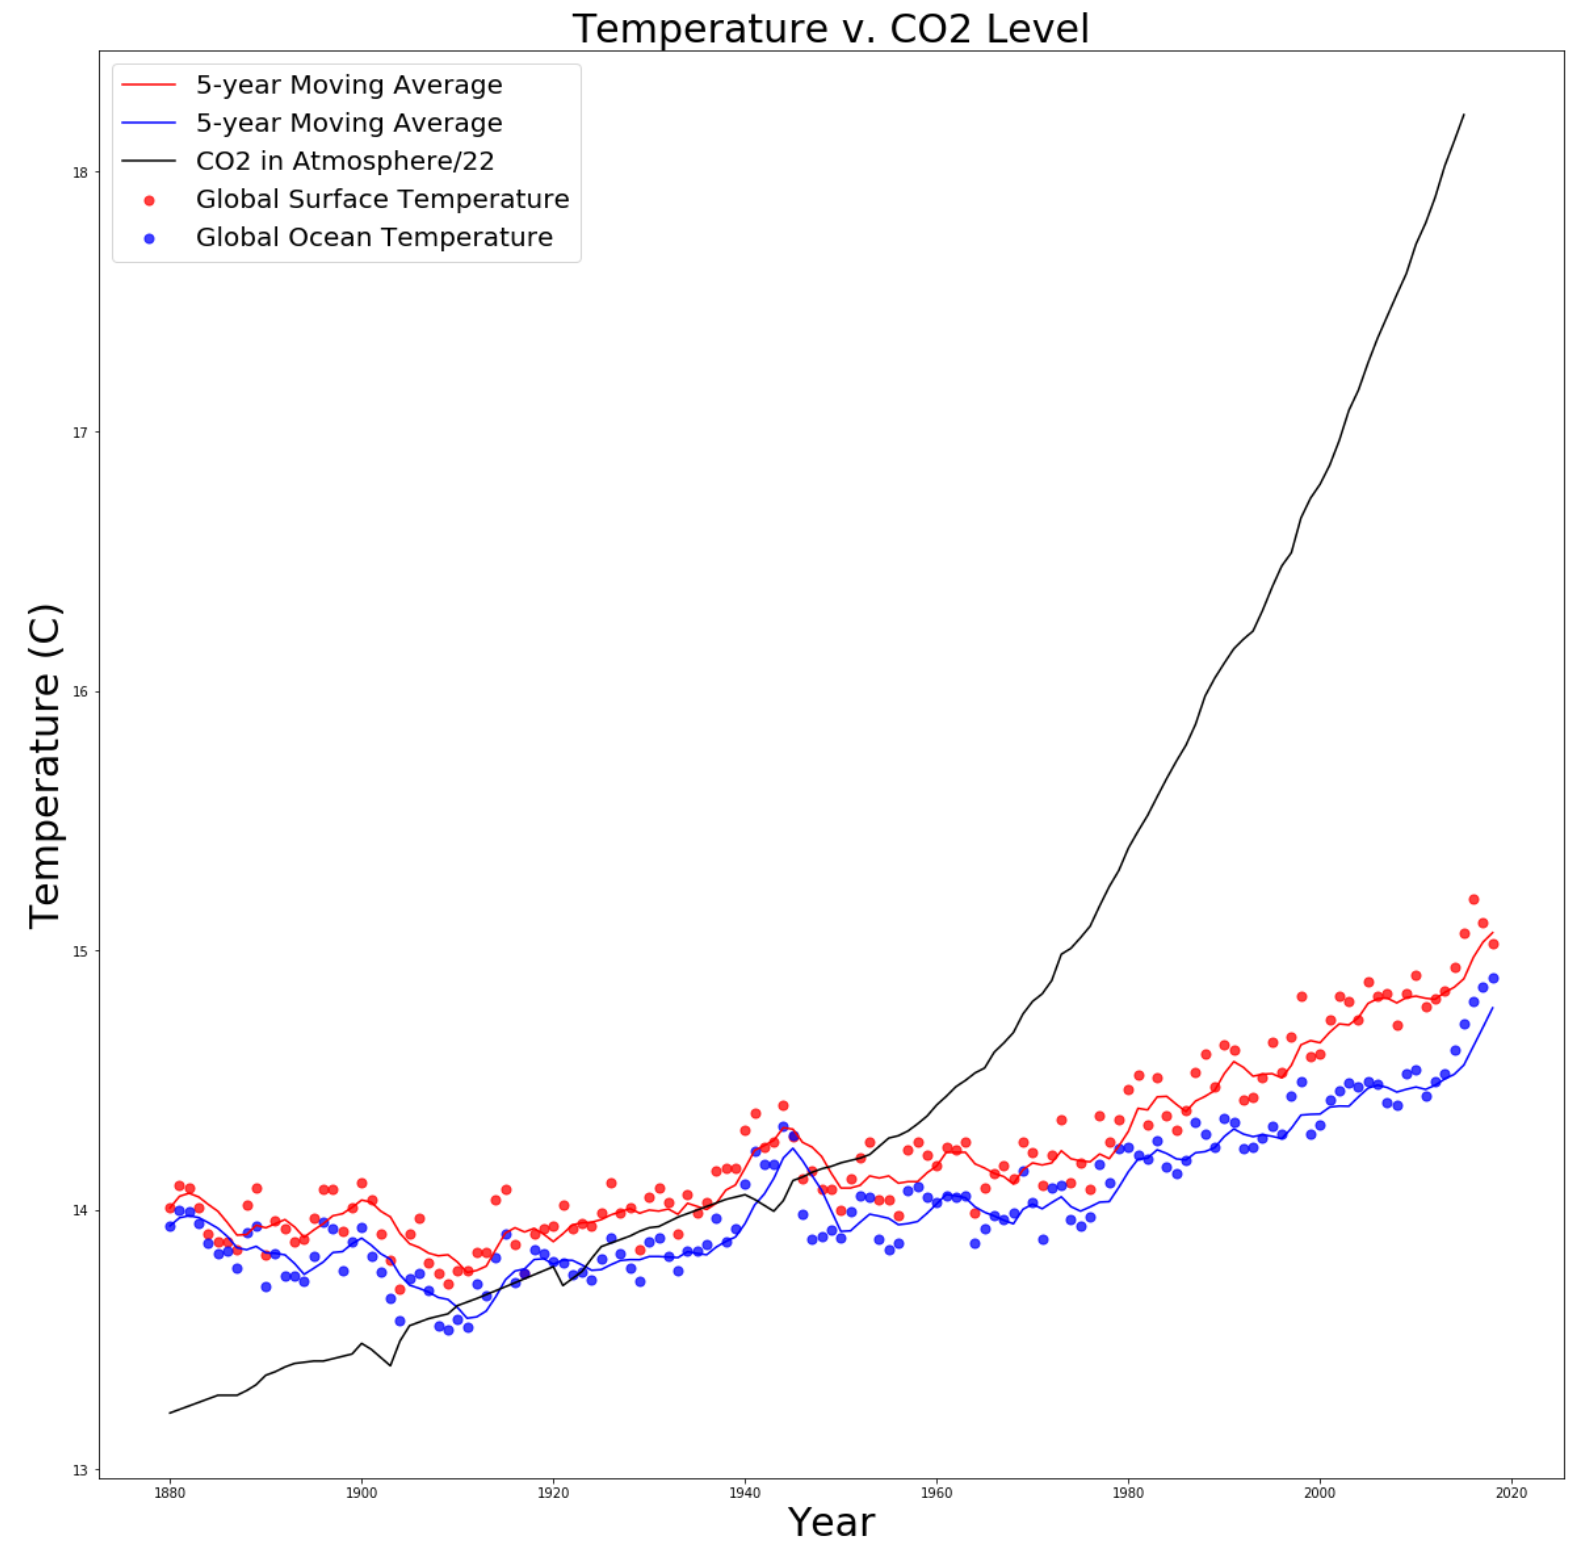
In the above plot, the heating of the land's magnitude is growing faster than the magnitude of the ocean (since the ocean is slower than the total surface of the planet).
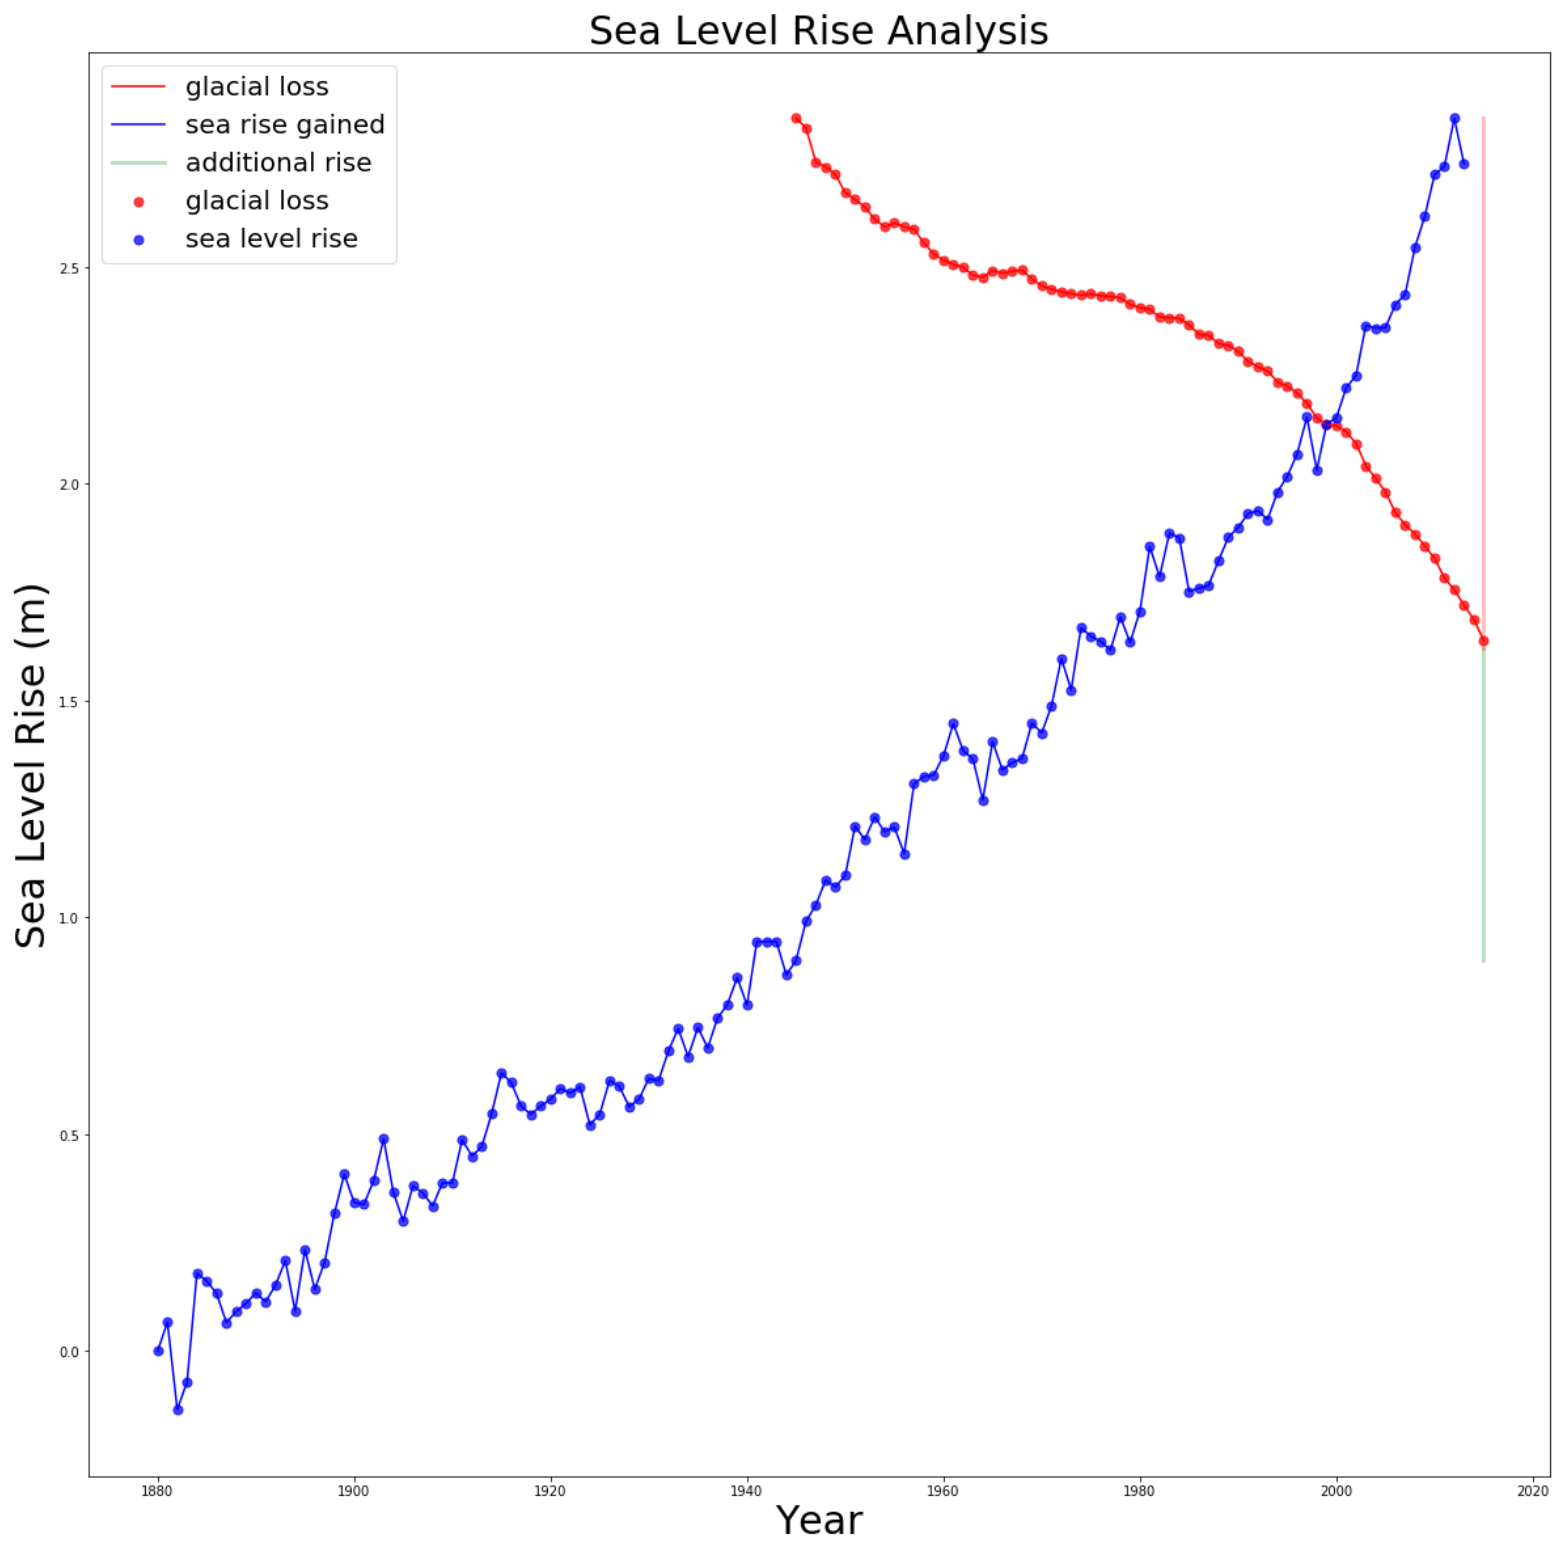
In the above plot, the meltwater from glacier melt is not enough to explain the total sea level rise trend. The green line's amount of change is from thermal expansion and other physical effects.
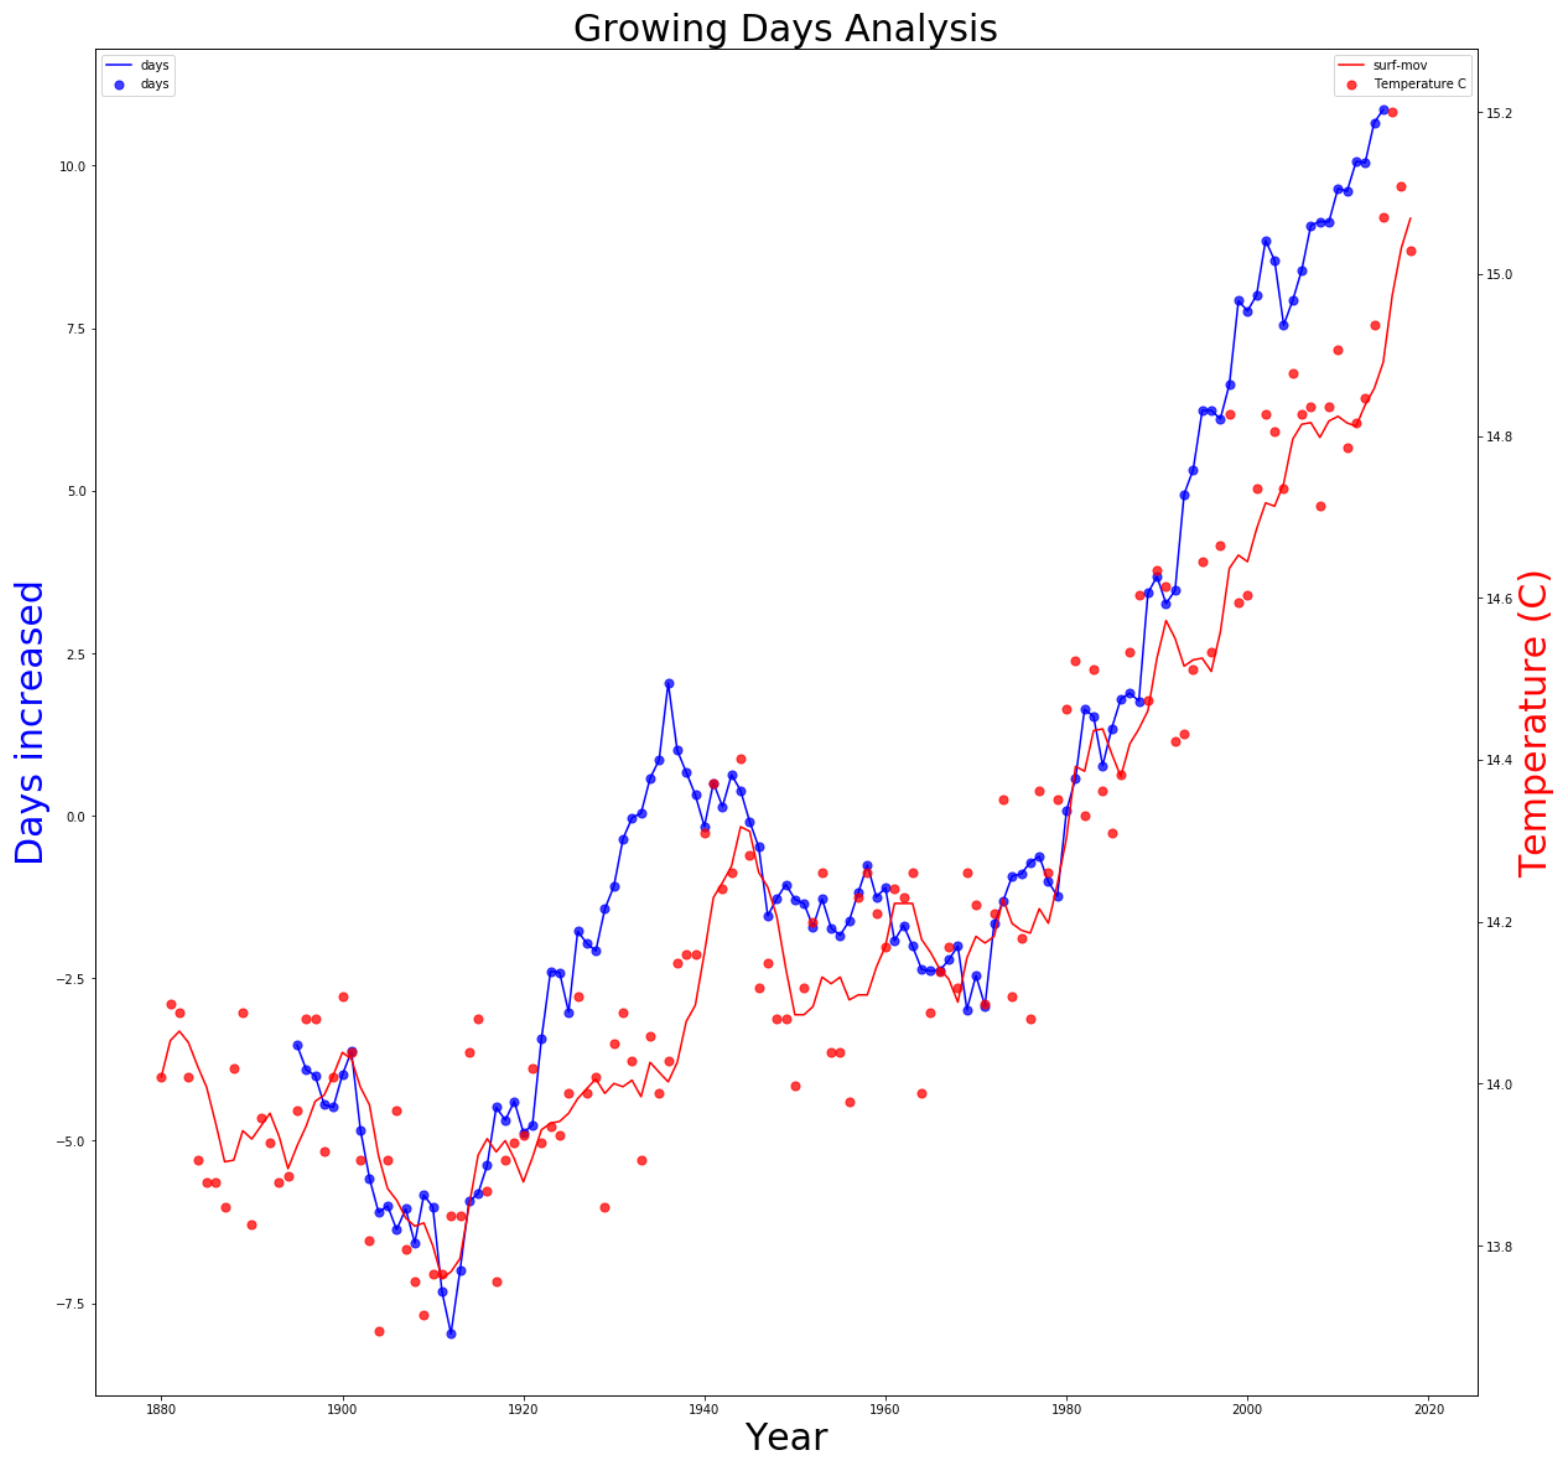
In the above plot there is a lag effect where the growing season is expanding before the change in temperature hits (in a five-year moving average trend line).
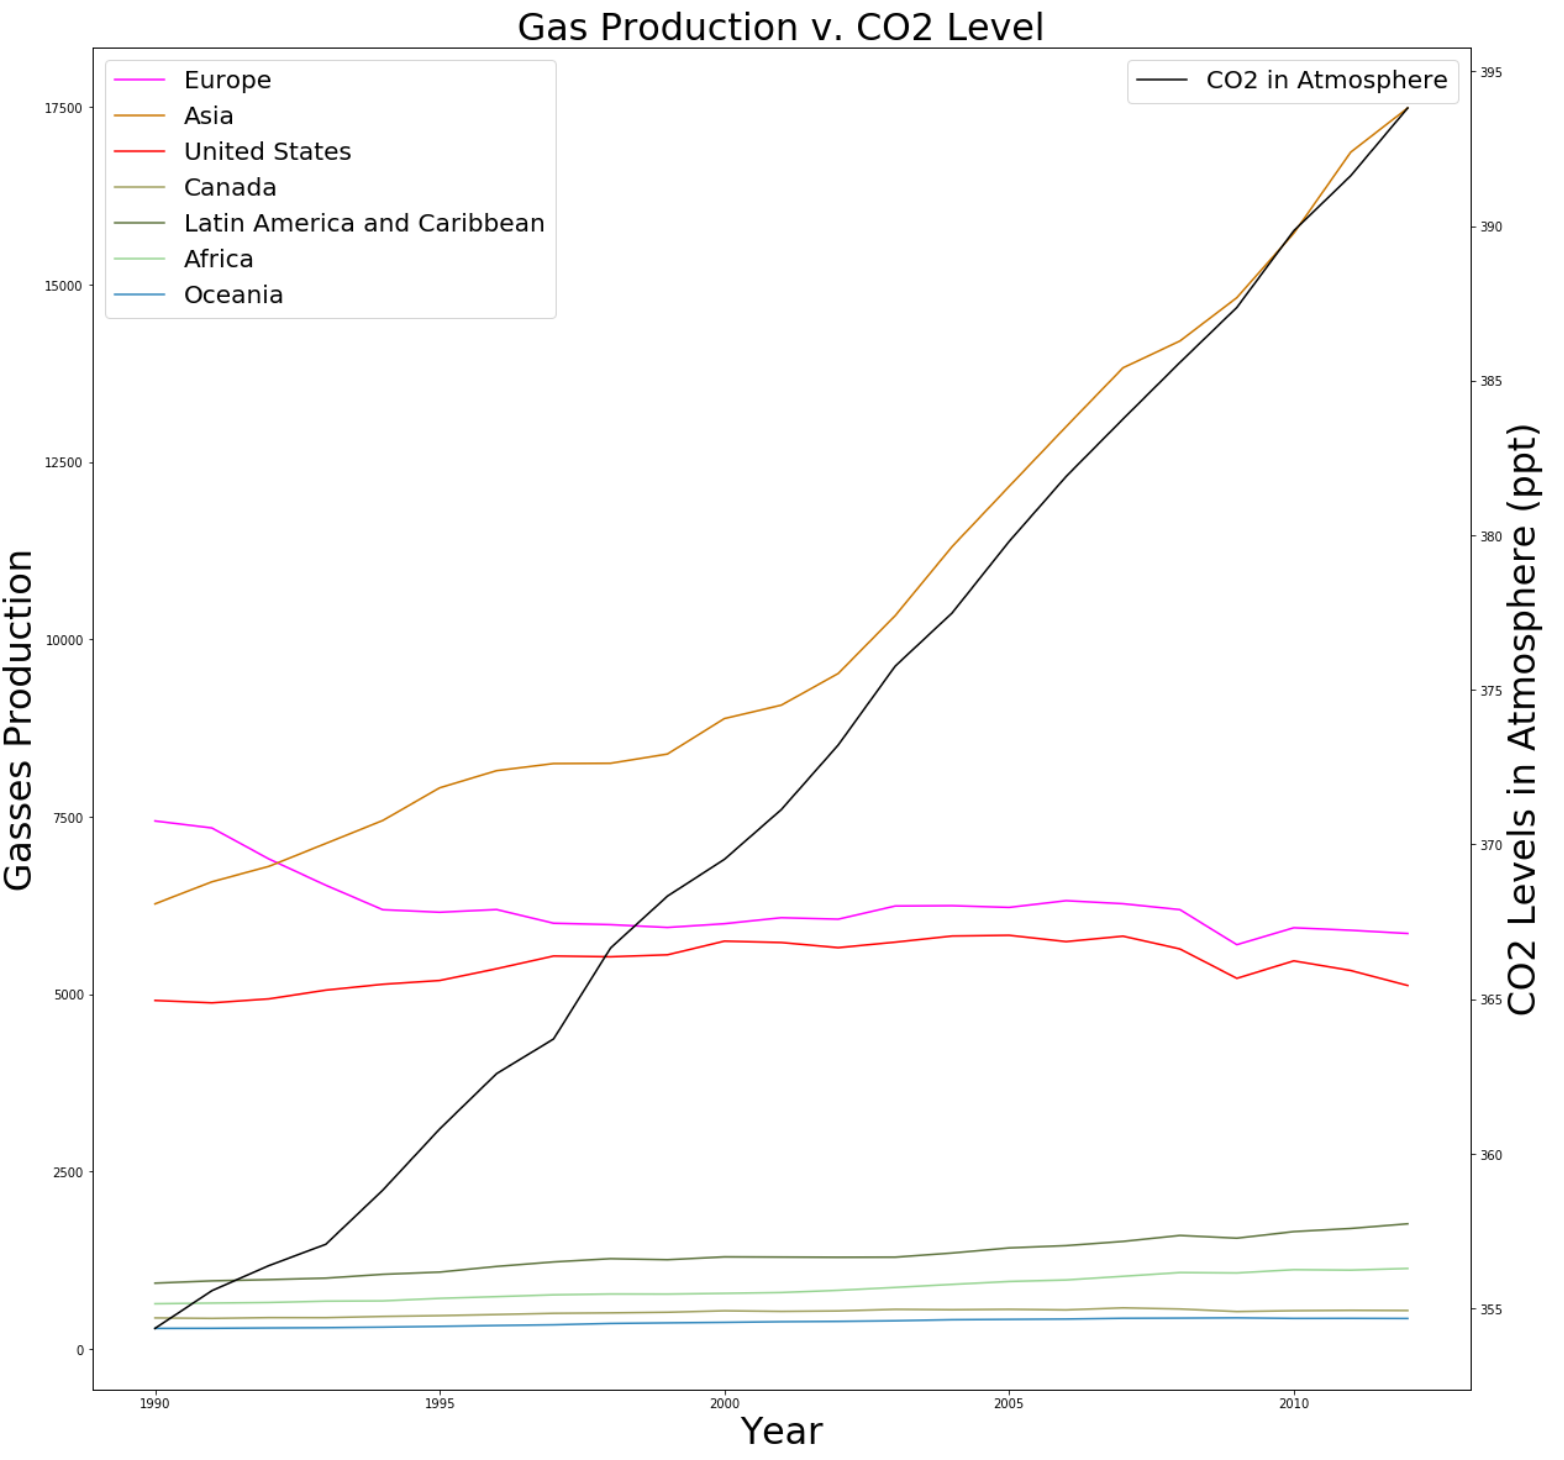
In the above plot (created by Cindy in class), the Asian contribution to change in atmospheric gasses (represented by the CO2 component) has been a dramatic increase compared with the gas production from other regions.
Students were encouraged to find other data sets and create preliminary plots to investigate the data in the context of helping form hypotheses about potential climate change effects. They were asked to keep the climate change model in mind as they found new data — the goal being to be able to get all data into one organized repository.
The data comes from:
Global surface temperature (NOAA)
https://www.climate.gov/news-features/understanding-climate/climate-change-global-temperature

Global surface temperature (Wikipedia)
https://en.wikipedia.org/wiki/Instrumental_temperature_record

Global sea surface temperature
https://www.epa.gov/climate-indicators/climate-change-indicators-sea-surface-temperature

Global Greenhouse Gas Emissions
https://www.epa.gov/climate-indicators/climate-change-indicators-global-greenhouse-gas-emissions

Atmospheric Concentrations of Greenhouse Gases
https://www.epa.gov/climate-indicators/climate-change-indicators-atmospheric-concentrations-greenhouse-gases

Glaciers: Meters of water equivalent
https://www.epa.gov/climate-indicators/climate-change-indicators-glaciers

Sea Level Rise
https://www.epa.gov/climate-indicators/climate-change-indicators-sea-level

Lyme Disease Incidence (per 100,000)
https://www.epa.gov/climate-indicators/climate-change-indicators-lyme-disease

US Average Growing Season (days)
https://www.epa.gov/climate-indicators/climate-change-indicators-length-growing-season
Interesting plots created from the climate-change.ipynb Python notebook included in the archive sparked a discussion:
In the above plot, the heating of the land's magnitude is growing faster than the magnitude of the ocean (since the ocean is slower than the total surface of the planet).
In the above plot, the meltwater from glacier melt is not enough to explain the total sea level rise trend. The green line's amount of change is from thermal expansion and other physical effects.
In the above plot there is a lag effect where the growing season is expanding before the change in temperature hits (in a five-year moving average trend line).
In the above plot (created by Cindy in class), the Asian contribution to change in atmospheric gasses (represented by the CO2 component) has been a dramatic increase compared with the gas production from other regions.
Students were encouraged to find other data sets and create preliminary plots to investigate the data in the context of helping form hypotheses about potential climate change effects. They were asked to keep the climate change model in mind as they found new data — the goal being to be able to get all data into one organized repository.