

Bathymetry Javascript Example
Javascript is a popular script-driven computing environment for doing data analysis through visualization techniques. Javascript runs in a Web browser. Below is an example of a Javascript script, using a bathymetry plot as an example. Compare the Javascript script with the Python script to see the differences in approach. The Javascript script is shown here:
<!DOCTYPE html>
<html lang="en">
  <head>
    <meta charset="utf-8">
    <title>Plot Bathymetry</title>
    <link rel="stylesheet" href="style.css">
    <script src="script.js"></script>
  </head>
  <body>
    <input type="file" name="file" id="file"><br/><br/>
    <canvas id="plot" width="2500" height="2500"></canvas>
  </body>
  <script>
  function getColor(value) {
    color = [];
    if(value != undefined && value[0] == '-') {
  		color.push(Math.floor(20));
  		color.push(128-Math.floor(-1*value*5));
  		color.push(Math.floor(-1*value*5));
    } else {
		color = [0,0,0];
  	}

  	return color;
  }

  function plot(data, ncols, row) {
    values = data.split(' ');
  	for(i=0; i<ncols; i++) {
	  var c = document.getElementById("plot");
	  var ctx = c.getContext("2d");
	  color = getColor(values[i]);
	  ctx.fillStyle = "rgba("+color[0]+","+color[1]+","+color[2]+",1)";
	  ctx.fillRect( i, row, 1, 1 );
	}
  }

  document.getElementById('file').onchange = function() {
	var file = this.files[0];
	var reader = new FileReader();
	reader.onload = function(progressEvent){
	  //Read the lines into an array
	  var lines = this.result.split('\n');
	  var ncols = lines[0].split(' ');
	  ncols = ncols[1];
	  var nrows = lines[1].split(' ');
	  nrows = nrows[1];
	  document.getElementById('plot').width = ncols;
	  document.getElementById('plot').height = nrows;
	  var count=0;
	  for(var line = 6; line < lines.length; line++){
		plot(lines[line], ncols, count);
		count++;
	  }
	};
	reader.readAsText(file);
  };
  </script>
</html>
The script runs in any Web-compliant browser. The script can run as a file with a .js extension or as embedded in an HTML file with a .html extension.
With Javascript, multiple modules of code can be loaded as .js files. They have to be explicitly identified in the HTML file through SCRIPT nodes.
You can determine which modules load at runtime by including them properly in an HTML file.
I probably have overdone it as Javascript takes a while to load as a result of all the modules it readies at launch time.
When you run a script within Javascript, you can run one line at a time (like the control we have over using Python in a Jupyter notebook).
Every time an alert() function statement is encountered in the script, the script pauses at that point (and reports the value of whatever appears
within the parentheses.
The script above loads but then waits for an appropriate data file to be selected in a file selection dialog box.
A ri_grid.asc file is available on the class website for use with the script above. Just download the file and save it
in the same location (same folder) where you've put the bathy.html file. Use the Browse button to select the data file and then wait
for the JavaScript to run. The code should produce bathymetry plot seen here:
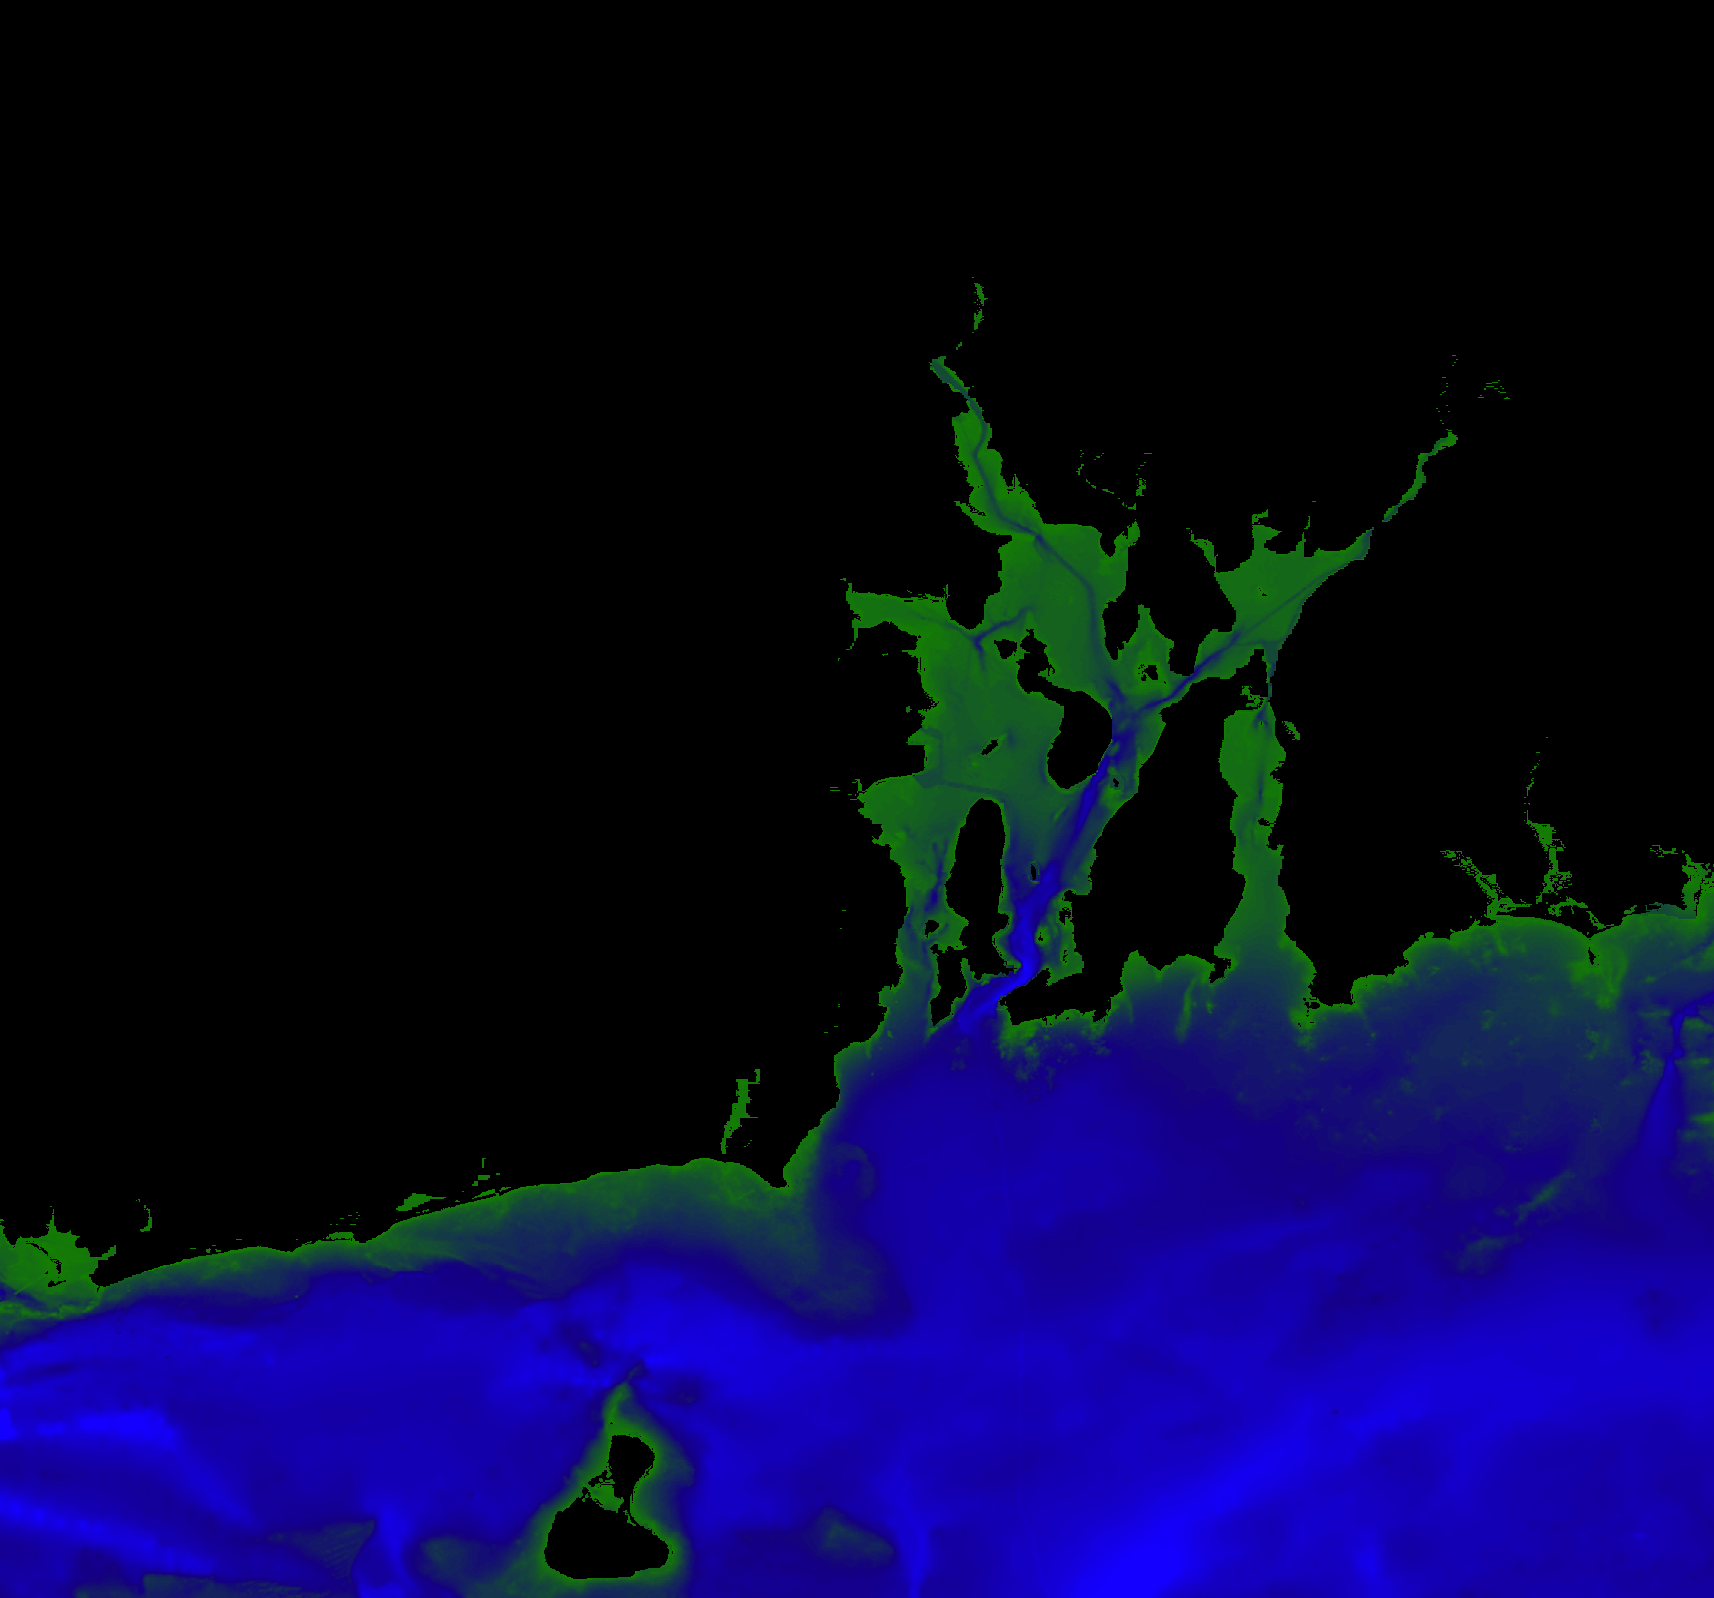
The plotting code here in Javascript is very raw but functional. The coloring algorithm is simplified but we will extend it to be more sophisticated
during the course. The Python code is more elaborate in that it is run from a well-crafted plotting library. We will see a lot of well-crafted
plotting libraries written in JavaScript during this course. Some will be embedded in data visualization frameworks.