

Class on April 1 2019
Students were asked to consider three popular websites that provide JavaScript-based libraries that support building interactive data visualization
strategies for presentation in, and distribution by, a Web browser:
D3 Library Gallery
GoJS Diagramming Library
The Bokeh Library
Bruce followed by leading an interactive lecture and discussion on how students could use libraries/frameworks in their climate change analytics projects. Bruce demonstrated an example of his own project that used D3 to sketch the idea and then the Processing.js library to implement it. Processing is a language that has been implemented in many different programming languages. There is a Python binding for Python-based implementations, but the JavaScript binding leads itself to immediate presentation in, and distribution by, the Web browser.
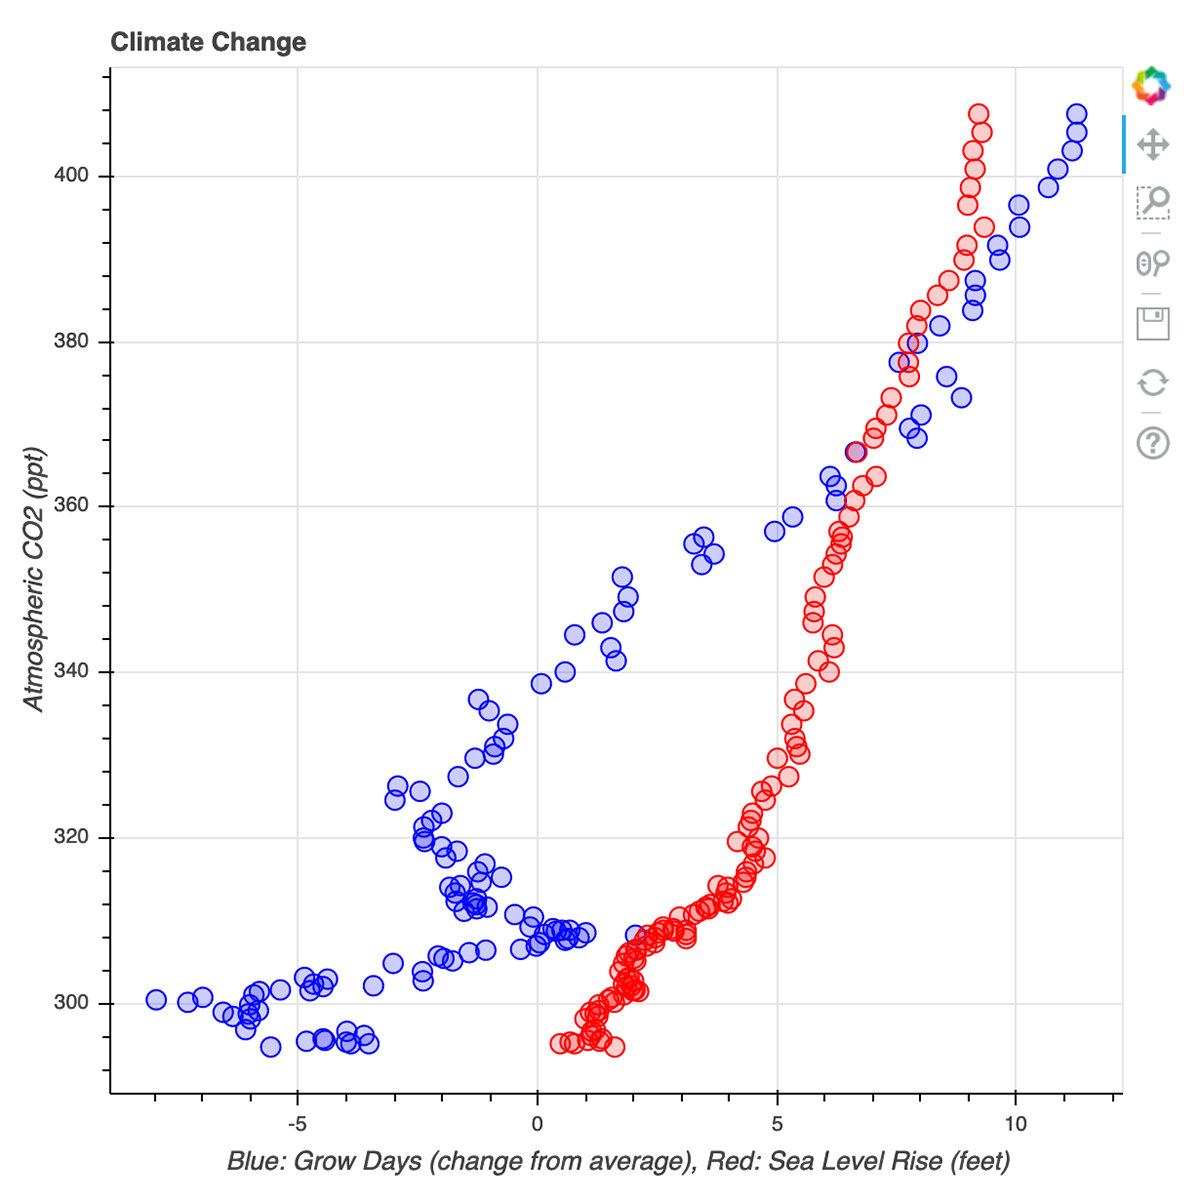
Students downloaded a week 6 file archive that demonstrated examples of creating scatterplots for web presentation in a browser. Students can generate the plot here by running the bokeh_scatterplot_example.ipynb notebook:
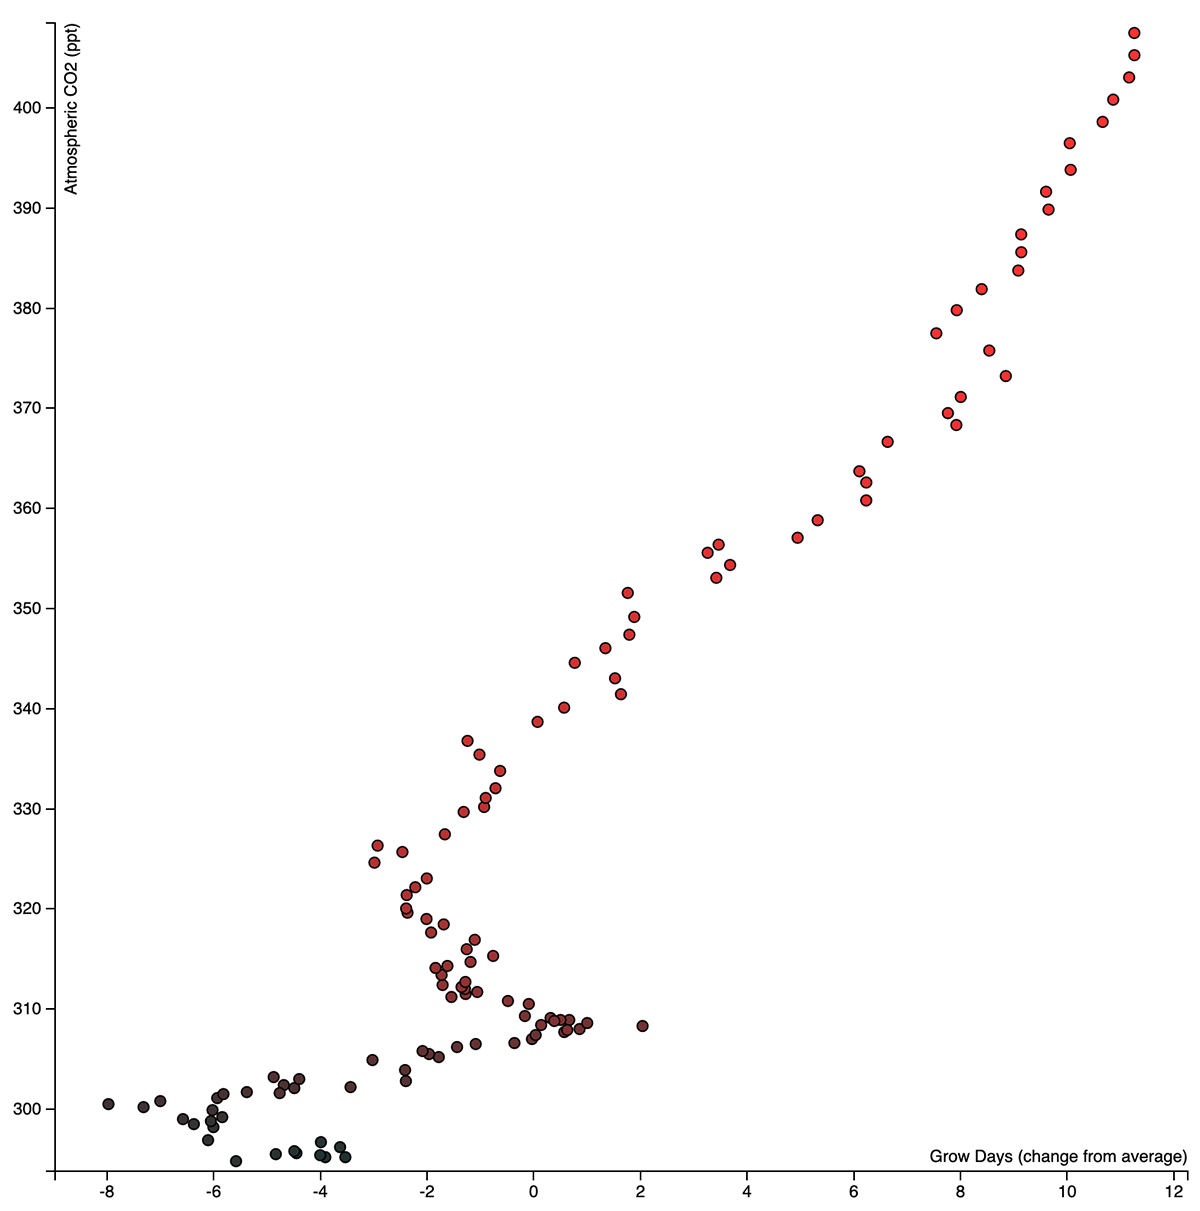
Students can generate the plot here by running the D3_scatterplot.html code in a browser:
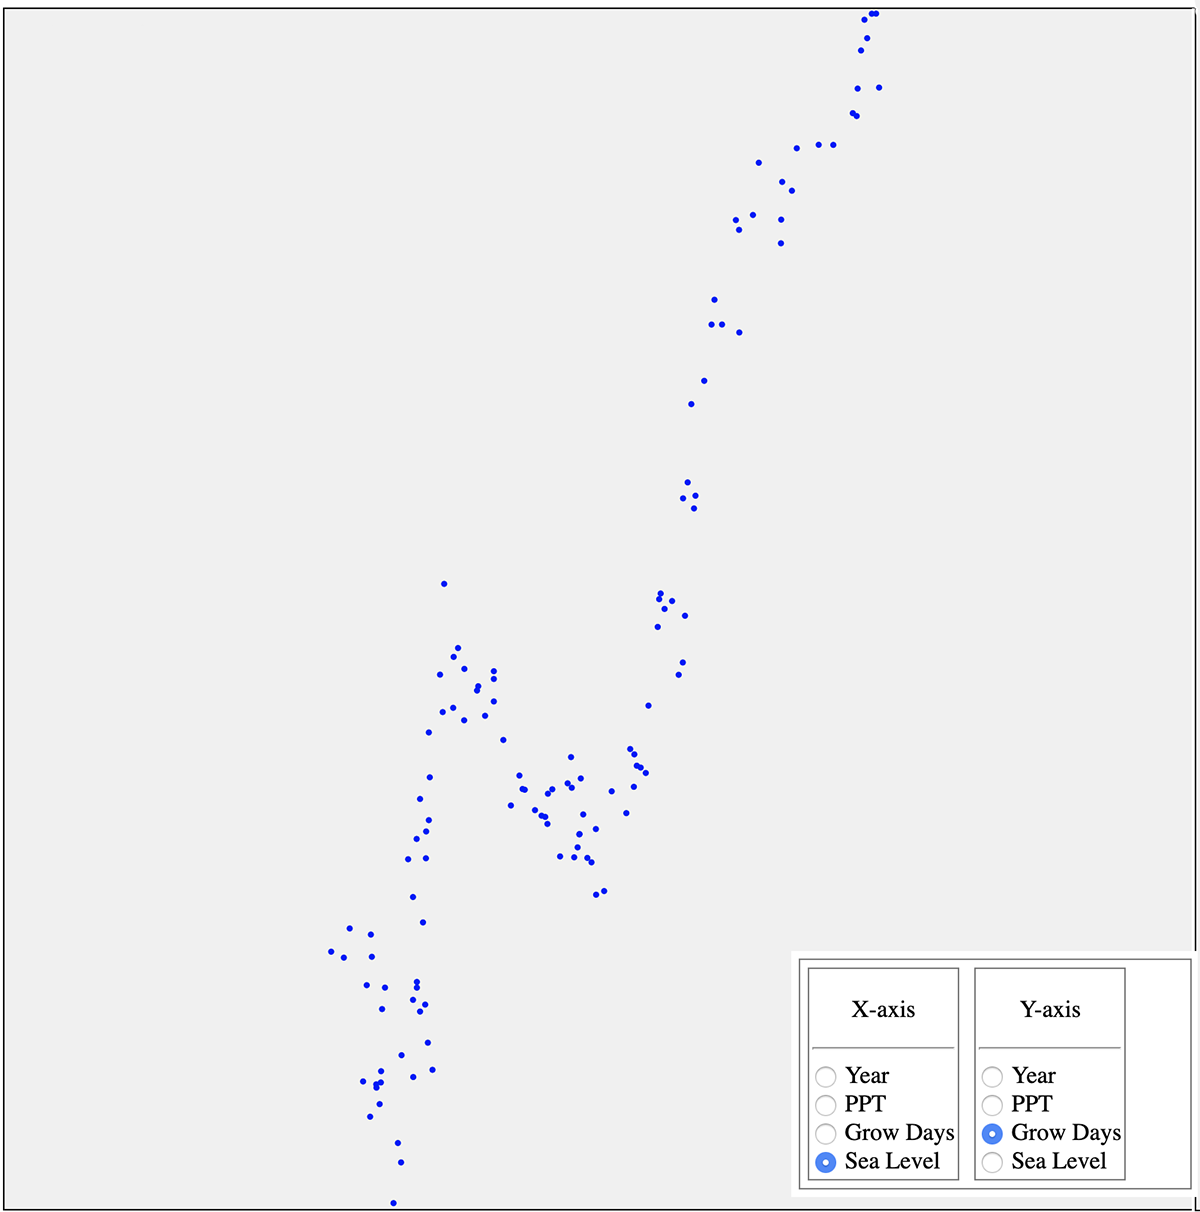
Students can generate the plot here by running the GOJS_scatterplot.html code in a browser:
Bruce then led an interactive discussion regarding the storyboards students had brought to describe their project ideas. Cindy's storyboard was a good representation of what students were capable of creating.
We finished up the class by adding the ocean_temp temperature data from the week 5 archive to the climate.csv file and then making sure we could update Bokeh, D3, and GoJS code to use the ocean_temp data in visualizations.
D3 Library Gallery
GoJS Diagramming Library
The Bokeh Library
Bruce followed by leading an interactive lecture and discussion on how students could use libraries/frameworks in their climate change analytics projects. Bruce demonstrated an example of his own project that used D3 to sketch the idea and then the Processing.js library to implement it. Processing is a language that has been implemented in many different programming languages. There is a Python binding for Python-based implementations, but the JavaScript binding leads itself to immediate presentation in, and distribution by, the Web browser.
Students downloaded a week 6 file archive that demonstrated examples of creating scatterplots for web presentation in a browser. Students can generate the plot here by running the bokeh_scatterplot_example.ipynb notebook:
Students can generate the plot here by running the D3_scatterplot.html code in a browser:
Students can generate the plot here by running the GOJS_scatterplot.html code in a browser:
Bruce then led an interactive discussion regarding the storyboards students had brought to describe their project ideas. Cindy's storyboard was a good representation of what students were capable of creating.
We finished up the class by adding the ocean_temp temperature data from the week 5 archive to the climate.csv file and then making sure we could update Bokeh, D3, and GoJS code to use the ocean_temp data in visualizations.