

Class on April 10 2019
In class workshop for climate change project
Students worked on an in-class hands-on assignment to gain familiarity with the D3 approach to creating interactive visualizations within a Web browser.
The map is generated through JavaScript code (see map.js in the js folder) that depends on the D3 and topoJSON libraries (included through HTML SCRIPT elements):
Students were asked to study the structure of the JSON file, noticing the standard syntax of [, {, and commas to delimit meaning in the file. For example, the code shown immediately below identifies the code relevant to the country of Aruba in the map. Five of the JSON nodes are highlighted as they are discussed in the code segments below. The name attribute (green) is used as country name tooltip when the mouse cursor enters the geometry of a country. The geometry element (yellow) includes the information necessary to draw a polygon for Aruba on the map (with two attributes of type and coordinates). Three mapcolor attributes (blue) are used to color Aruba on the map:
Looking at the map.js JavaScript code, line 122 starts the code that sets the output up in a Scalable Vector Graphics (SVG) context, and uses Cascading Style Sheet (CSS) syntax to identify the proper element and properties for use in the HTML file (note how D3 uses a method chain syntax to modify code objects — all the code below is a single compound JavaScript statement):
Note how the three mapcolor elements highlighted blue in the JSON file above are used to color each country in the map with fill (using an rgb() method with red channel = 120, green channel = 60, and blue channel = 60).
The globe JSON code is much simpler than in the first map example above. There are many less properties to describe the countries as they are represented on the globe. In fact, the one unique identifier, a property attribute named id contains what looks like an arbitrary integer as its value. Simple country borders (those that can be represented by a single closed polygon) are identified by type "Polygon" while those that require multiple polygons are identified by "MultiPolygon". The polygon sides end coordinates are identified by an index number into coordinates provided in the bottom half of the JSON file. The coordinates are mapped to a sphere object that is created (instead of the background rectangle the map uses) using two values that work like latitude and longitude values work to identify a location on Earth. Because the borders appear on a sphere, they are created as arcs instead of lines:
Line 18 in the globe.js starts the generation of an SVG element for use in the HTML. Line 41 starts the code for using the world-110m.json JSON code in a D3 json() method:
There are no map coloring properties in the JSON file for the globe presentation. Instead, the JavaScript uses the D3 filter() method to color the map based on the id property. The countries with an id property greater than 80 are colored yellow with this code:
Another completely mutually exclusive append() method adds a different set of countries to the map (coloring those black):
Additional data can be added to the visualization using the CSV file format, with an id column as a key to the additional columns to be referenced in code. The countries.csv file in the development archive is an example of a valid data addition CSV file which works with the following globe.html code:
Students worked on an in-class hands-on assignment to gain familiarity with the D3 approach to creating interactive visualizations within a Web browser.
D3 Map Example
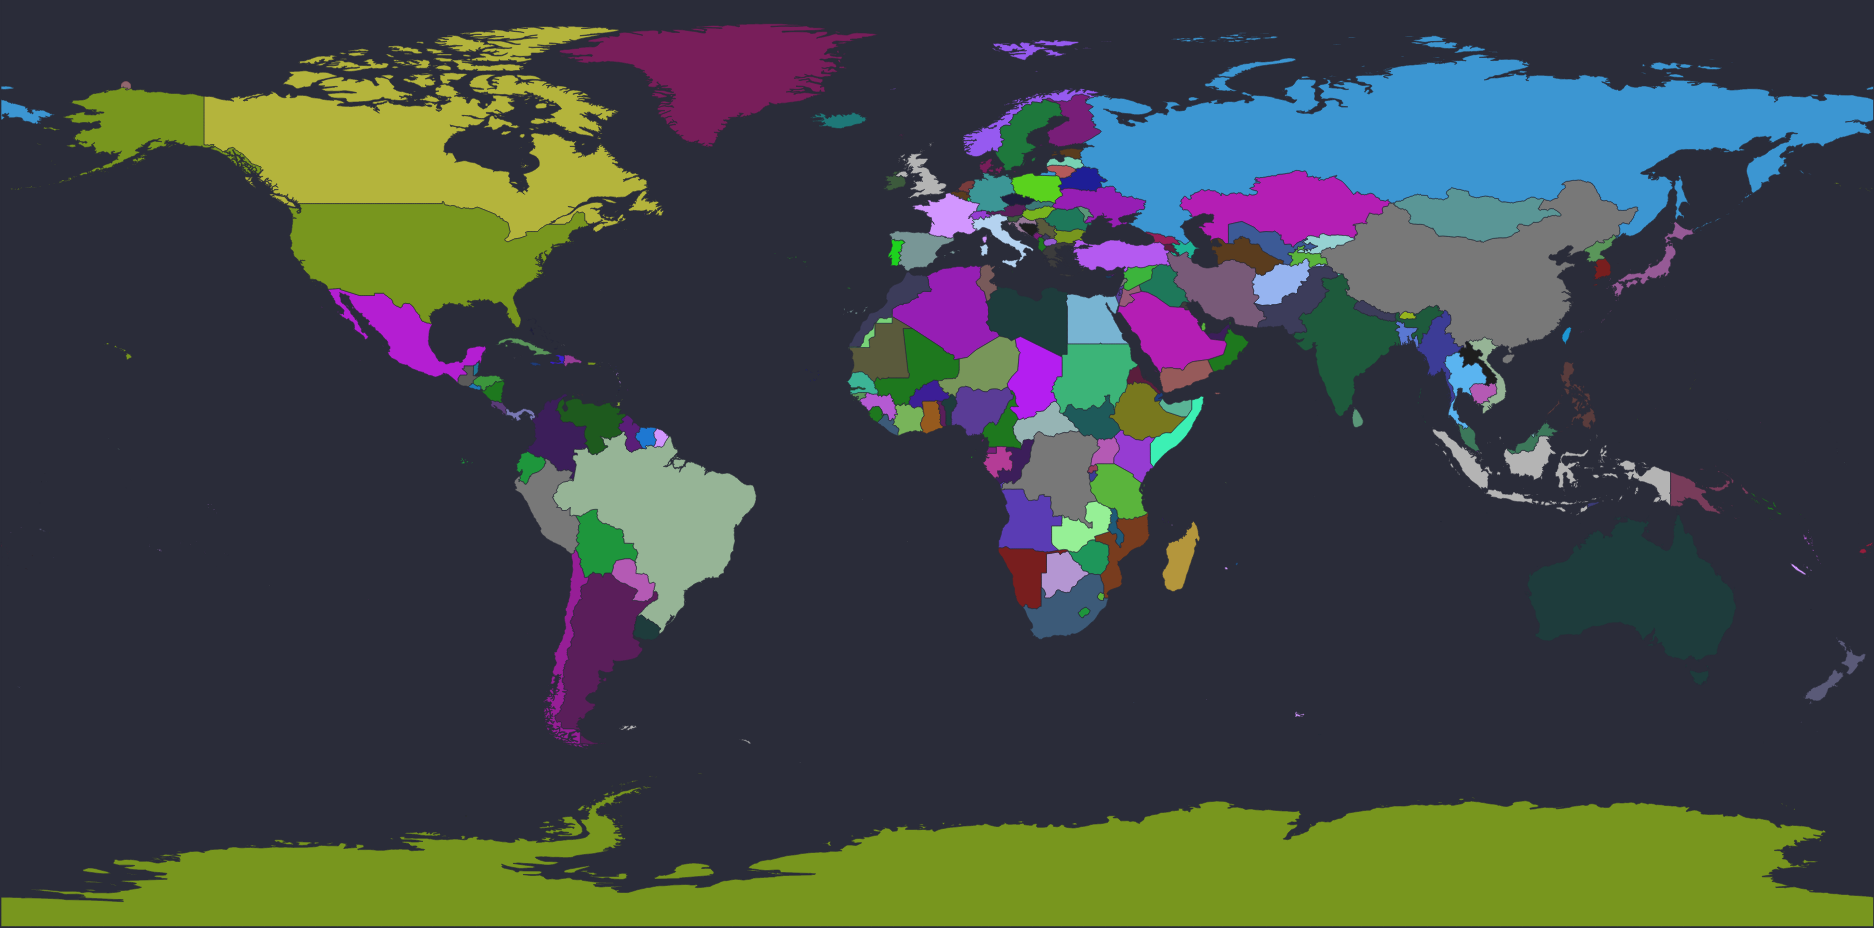
Students started by downloading a development archive to use in class. Within the archive, the map.html file, when opened in a browser, shows a map of the world:
The map is generated through JavaScript code (see map.js in the js folder) that depends on the D3 and topoJSON libraries (included through HTML SCRIPT elements):
	<script src="https://d3js.org/d3.v4.min.js"></script>
	<script src="https://d3js.org/topojson.v1.min.js"></script>
and the JSON data provided by the world-custom.json file in the archive.
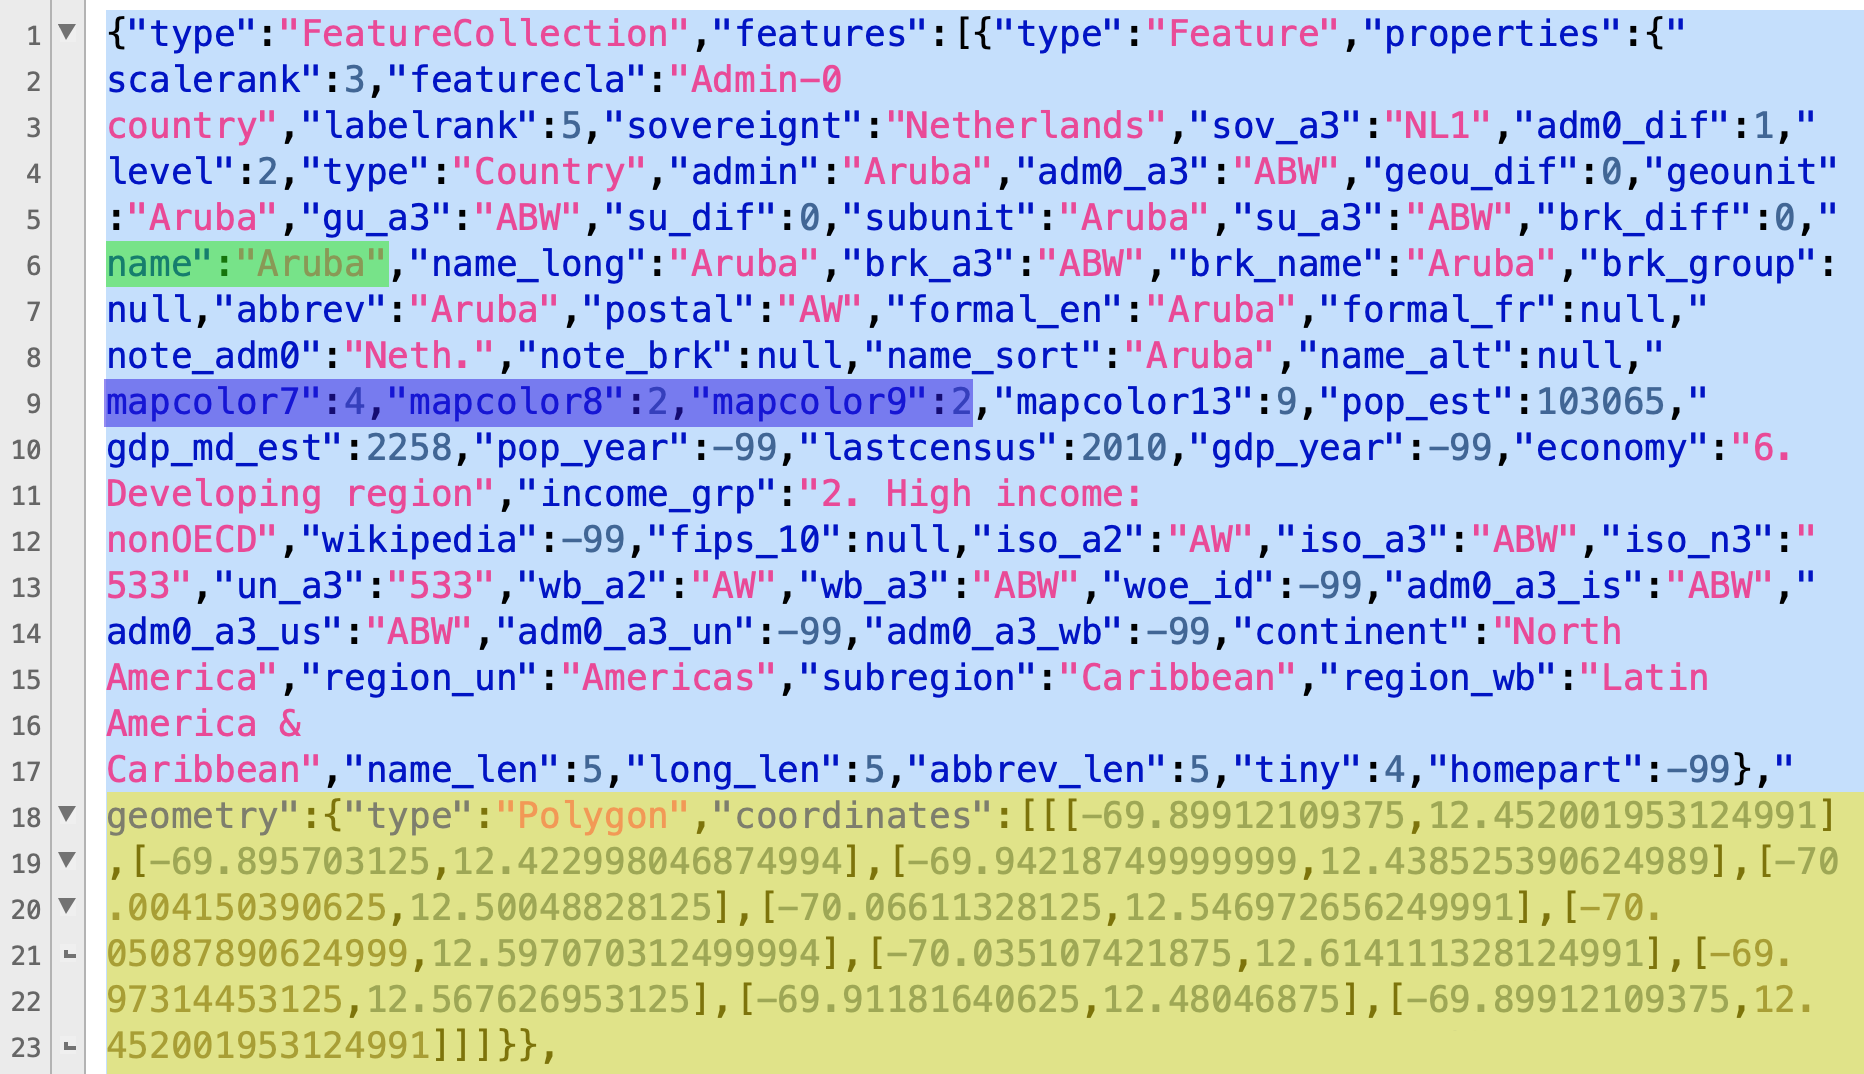
Students were asked to study the structure of the JSON file, noticing the standard syntax of [, {, and commas to delimit meaning in the file. For example, the code shown immediately below identifies the code relevant to the country of Aruba in the map. Five of the JSON nodes are highlighted as they are discussed in the code segments below. The name attribute (green) is used as country name tooltip when the mouse cursor enters the geometry of a country. The geometry element (yellow) includes the information necessary to draw a polygon for Aruba on the map (with two attributes of type and coordinates). Three mapcolor attributes (blue) are used to color Aruba on the map:
Looking at the map.js JavaScript code, line 122 starts the code that sets the output up in a Scalable Vector Graphics (SVG) context, and uses Cascading Style Sheet (CSS) syntax to identify the proper element and properties for use in the HTML file (note how D3 uses a method chain syntax to modify code objects — all the code below is a single compound JavaScript statement):
var svg = d3
  .select("#map-holder")
  .append("svg")
  // set to the same size as the "map-holder" div
  .attr("width", $("#map-holder").width())
  .attr("height", $("#map-holder").height())
  // add zoom functionality
  .call(zoom);
The code starting at line 133 uses the D3 JSON interface (through a .json() method) to draw the map from the JSON file data. The json() method identifies the .json file to use as its first
parameter, and sets an anonymous drawing function as the second parameter (the contents of which can be quite extensive). The first drawn shape is a rectangle to fill the map space as a
background element (finding the HTML element that has a ID="map" attribute). The shapes append to the SVG element created above. The #map selector is available for use in a style
sheet (understanding how D3 works with elements and attributes, using the attr() method, is very useful).
d3.json(
  "world-custom.json", function(json) {
    //Bind data and create one path per GeoJSON feature
    countriesGroup = svg.append("g").attr("id", "map");
    // add a background rectangle
    countriesGroup
      .append("rect")
      .attr("x", 0)
      .attr("y", 0)
      .attr("width", w)
      .attr("height", h);
Further down in the .json() function, the countries are drawn as features from the features element in the JSON file. The path used to draw the countries is given an attribute named
d and additional nested elements and attributes can be referenced from the d attribute. In addition to using the d.properties.name attribute highlighted green in the JSON content
above, the ID attribute for each country is set to the three-character International Standards Organization (ISO) code prefixed by the word "country" (so the ID is "countryABW" for the Aruba
map object).
Note how the three mapcolor elements highlighted blue in the JSON file above are used to color each country in the map with fill (using an rgb() method with red channel = 120, green channel = 60, and blue channel = 60).
    countries = countriesGroup
      .selectAll("path")
      .data(json.features)
      .enter()
      .append("path")
      .attr("d", path)
      .attr("id", function(d, i) {
        return "country" + d.properties.iso_a3;
      })
	  .style("fill", function(d) {
		  return d3.rgb(d.properties.mapcolor7*30,
                                d.properties.mapcolor8*30,
                                d.properties.mapcolor9*30);
	  })
      .attr("class", "country");
Instead of using the recommended map colors from the map creator, we can use other data — for example, climate change data such as current greenhouse gas production by country. To do
so, we can add a gas_amt property in the JSON file by inserting it:
[...] "name_alt":null,"gas_amt":4887,"mapcolor7":4, [...]and then using it to color the country:
          .style("fill", function(d) {
                  return d3.rgb(30,d.properties.gas_amt/100,30);
          })
The example above uses a simple divide by 100 to get the value in a relative value between 0 and 255 (the valid range for an RGB channel).
D3 Globe Example
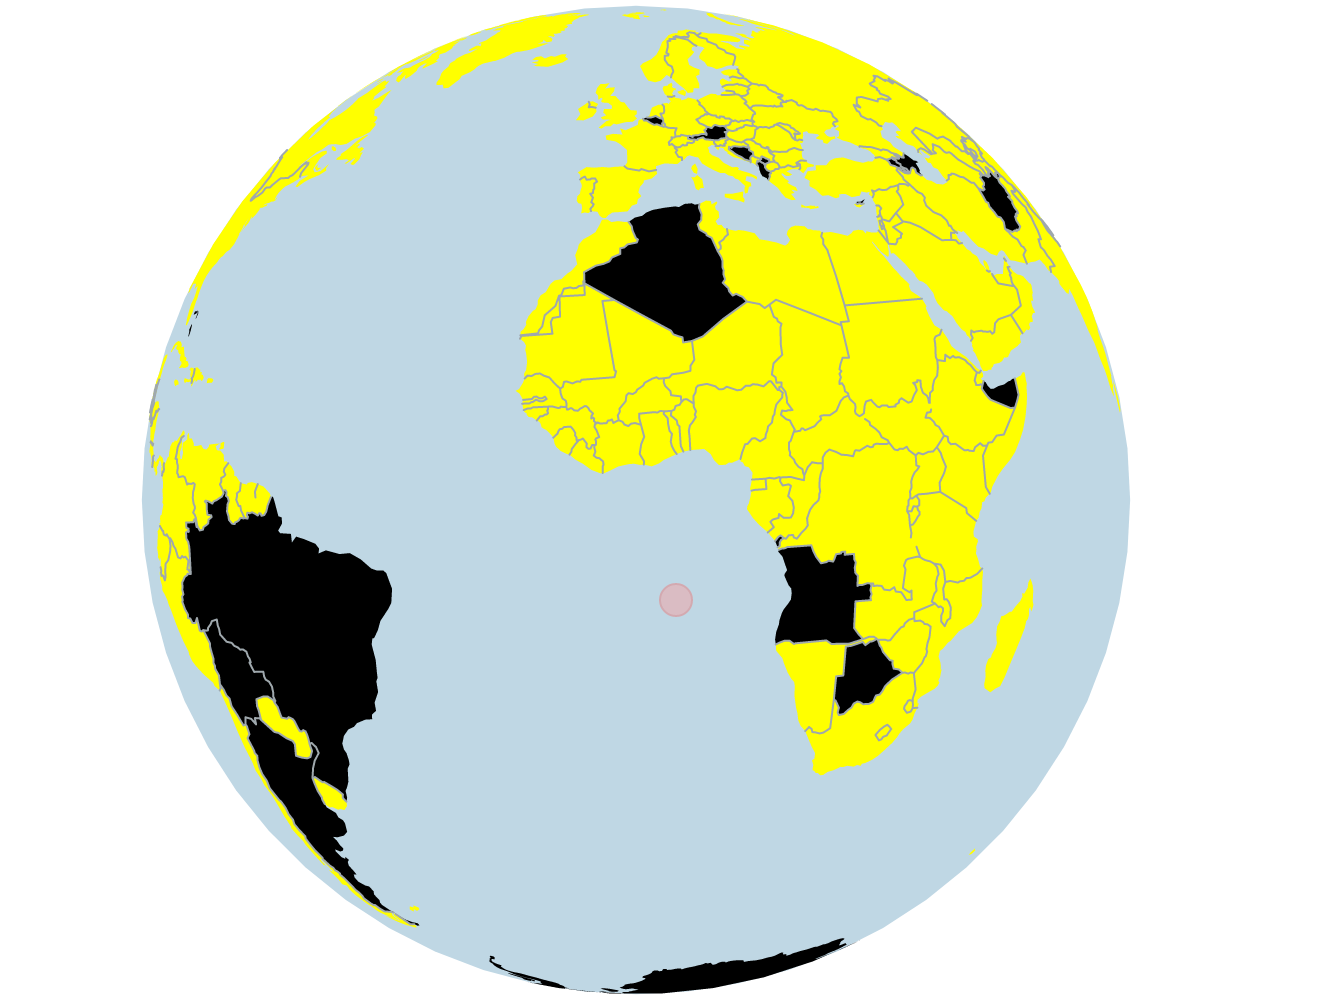
The development archive includes another global visualization base in the index.html, globe.js (in the js folder), and world-110m.json files. The relationship of the HTML, JavaScript, and JSON code is very similar and yet creates an interactive globe presentation:
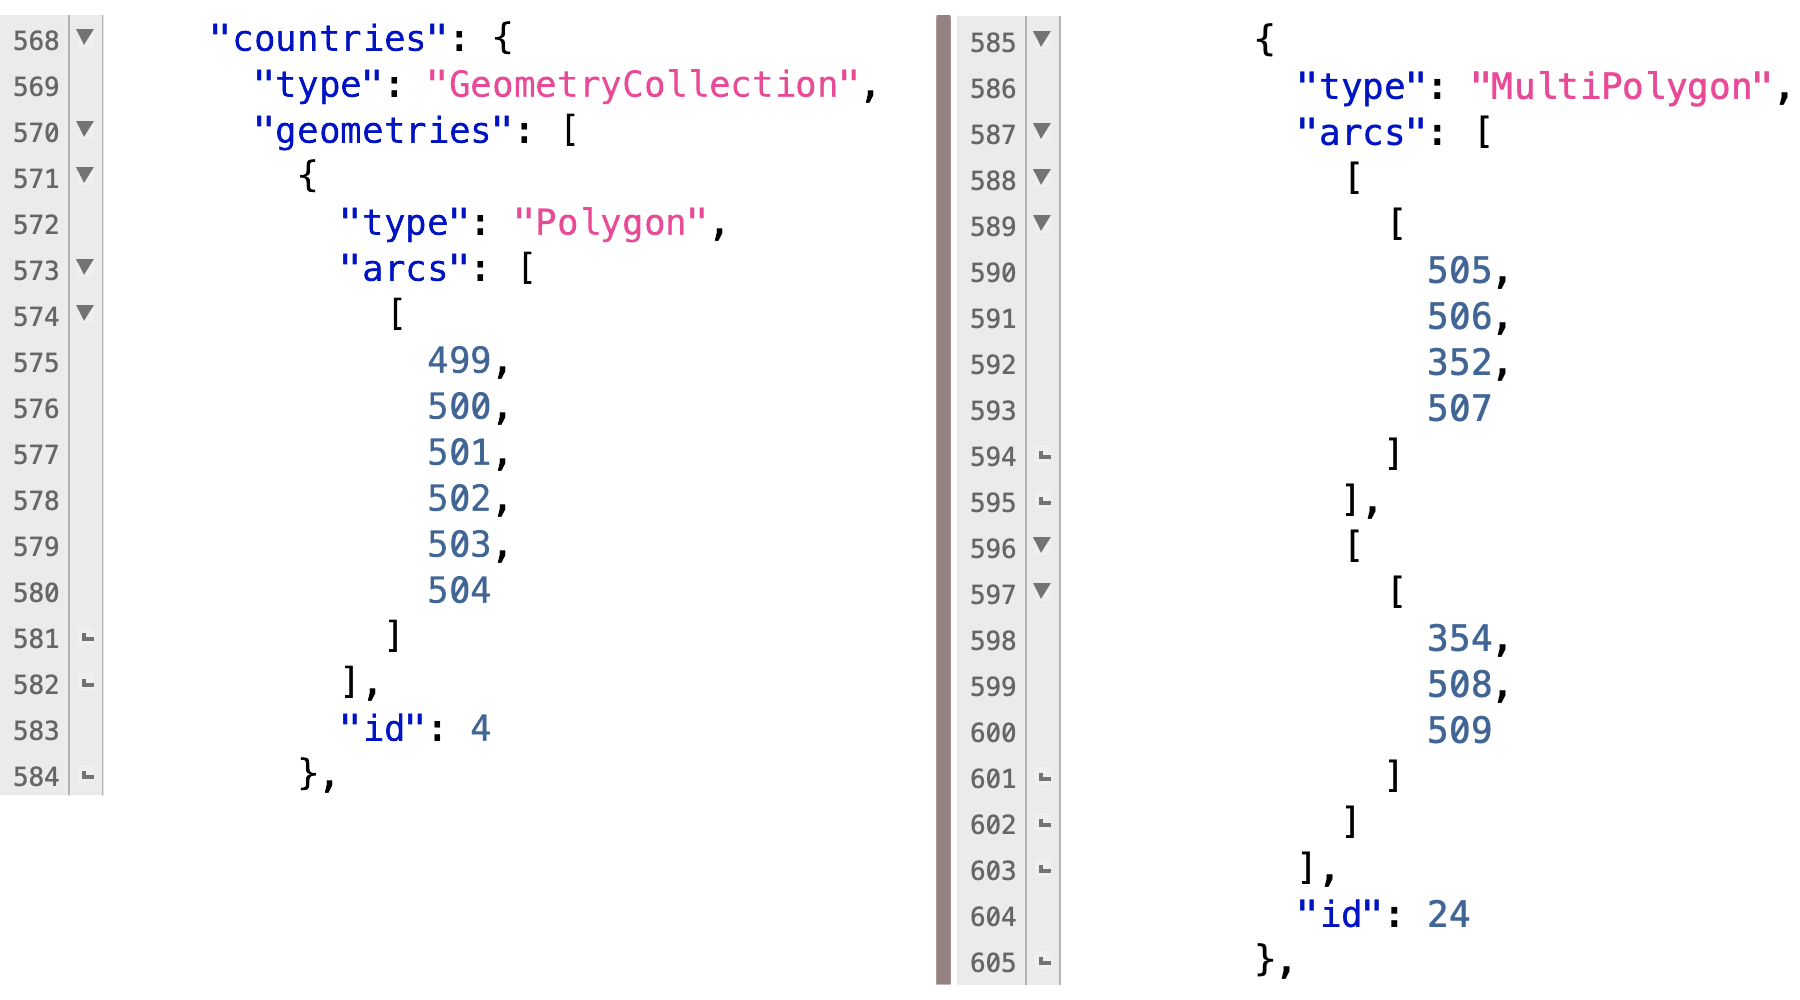
The globe JSON code is much simpler than in the first map example above. There are many less properties to describe the countries as they are represented on the globe. In fact, the one unique identifier, a property attribute named id contains what looks like an arbitrary integer as its value. Simple country borders (those that can be represented by a single closed polygon) are identified by type "Polygon" while those that require multiple polygons are identified by "MultiPolygon". The polygon sides end coordinates are identified by an index number into coordinates provided in the bottom half of the JSON file. The coordinates are mapped to a sphere object that is created (instead of the background rectangle the map uses) using two values that work like latitude and longitude values work to identify a location on Earth. Because the borders appear on a sphere, they are created as arcs instead of lines:
Line 18 in the globe.js starts the generation of an SVG element for use in the HTML. Line 41 starts the code for using the world-110m.json JSON code in a D3 json() method:
d3.json("world-110m.json", function(json) {
	map.append("path")
	.datum({type: "Sphere"})
	.attr("class", "ocean")
	.attr("d", path);
but notice the use of a type of Sphere.
There are no map coloring properties in the JSON file for the globe presentation. Instead, the JavaScript uses the D3 filter() method to color the map based on the id property. The countries with an id property greater than 80 are colored yellow with this code:
	map.append("path")
	.datum(topojson.merge(
    	    json,
    	    json.objects.countries.geometries
	    .filter(d => {
                 return d.id > 80
            })
	))
	.attr("class", "land")
	.attr("d", path)
	.style("fill", d3.rgb(255, 255, 0));
because the filter makes all other elements in the JSON be ignored, except those that meet the d.id > 80 criteria.
Another completely mutually exclusive append() method adds a different set of countries to the map (coloring those black):
	map.append("path")
	.datum(topojson.merge(
    	json,
    	json.objects.countries.geometries
	    .filter(d => {
                return d.id <= 80
            })
	))
	.attr("class", "land")
	.attr("d", path)
	.style("fill", "black");
Of course, all the descriptive properties for each country in the map JSON are quite relevant in the globe JSON file, and yet the size of the fuller JSON file is only 4K bytes! The lesson
here is that text is efficient to use in terms of network bandwidth and so most JSON files contain all possible properties of use to a developer. It's surprising to see the globe JSON not
include at least a name property to help with adding data properties for visualization by country.
Additional data can be added to the visualization using the CSV file format, with an id column as a key to the additional columns to be referenced in code. The countries.csv file in the development archive is an example of a valid data addition CSV file which works with the following globe.html code:
<!DOCTYPE html>
<html lang="en">
<head>
<meta charset="utf-8">
<title>Earth globe</title>
<script src="http://d3js.org/d3.v3.min.js"></script>
<script src="http://d3js.org/topojson.v1.min.js"></script>
<script src="http://d3js.org/queue.v1.min.js"></script>
</head>
<style type="text/css">

.water {
  fill: #00248F;
}

.land {
  fill: #A98B6F;
  stroke: #FFF;
  stroke-width: 0.7px;
}

.land:hover {
  fill:#33CC33;
  stroke-width: 1px;
}

.focused {
  fill: #33CC33;
}

select {
  position: absolute;
  top: 20px;
  left: 580px;
  border: solid #ccc 1px;
  padding: 3px;
  box-shadow: inset 1px 1px 2px #ddd8dc;
}

.countryTooltip {
  position: absolute;
  display: none;
  pointer-events: none;
  background: #fff;
  padding: 5px;
  text-align: left;
  border: solid #ccc 1px;
  color: #666;
  font-size: 14px;
  font-family: sans-serif;
}

</style>
<body>
  <script>
  var width = 600,
  height = 500,
  sens = 0.25,
  focused;

  //Setting projection
  var projection = d3.geo.orthographic()
  .scale(245)
  .rotate([0, 0])
  .translate([width / 2, height / 2])
  .clipAngle(90);

  var path = d3.geo.path()
  .projection(projection);

  //SVG container
  var svg = d3.select("body").append("svg")
  .attr("width", width)
  .attr("height", height);

  //Adding water

  svg.append("path")
  .datum({type: "Sphere"})
  .attr("class", "water")
  .attr("d", path);

  var countryTooltip = d3.select("body").append("div").attr("class", "countryTooltip"),
  countryList = d3.select("body").append("select").attr("name", "countries");

  queue()
  .defer(d3.json, "world-110m.json")
  .defer(d3.csv, "countries.csv")
  .await(ready);

  //Main function
  function ready(error, world, countryData) {

    var countryById = {},
    countries = topojson.feature(world, world.objects.countries).features;

   //Adding countries to select
    countryData.forEach(function(d) {
      countryById[d.id] = d.name;
      option = countryList.append("option");
      option.text(d.name);
      option.property("value", d.id);
    });

    //Drawing countries on the globe
    var world = svg.selectAll("path.land")
    .data(countries)
    .enter().append("path")
    .attr("class", "land")
    .attr("d", path)

    //Drag event
    .call(d3.behavior.drag()
      .origin(function() { var r = projection.rotate(); return {x: r[0] / sens, y: -r[1] / sens}; })
      .on("drag", function() {
        var rotate = projection.rotate();
        projection.rotate([d3.event.x * sens, -d3.event.y * sens, rotate[2]]);
        svg.selectAll("path.land").attr("d", path);
        svg.selectAll(".focused").classed("focused", focused = false);
      }))

    //Mouse events
    .on("mouseover", function(d) {
      countryTooltip.text(countryById[d.id])
      .style("left", (d3.event.pageX + 7) + "px")
      .style("top", (d3.event.pageY - 15) + "px")
      .style("display", "block")
      .style("opacity", 1);
    })
    .on("mouseout", function(d) {
      countryTooltip.style("opacity", 0)
      .style("display", "none");
    })
    .on("mousemove", function(d) {
      countryTooltip.style("left", (d3.event.pageX + 7) + "px")
      .style("top", (d3.event.pageY - 15) + "px");
    });

    //Country focus on option select
    d3.select("select").on("change", function() {
      var rotate = projection.rotate(),
      focusedCountry = country(countries, this),
      p = d3.geo.centroid(focusedCountry);

      svg.selectAll(".focused").classed("focused", focused = false);

    //Globe rotating
    (function transition() {
      d3.transition()
      .duration(2500)
      .tween("rotate", function() {
        var r = d3.interpolate(projection.rotate(), [-p[0], -p[1]]);
        return function(t) {
          projection.rotate(r(t));
          svg.selectAll("path").attr("d", path)
          .classed("focused", function(d, i) {
              return d.id == focusedCountry.id ? focused = d : false;
          });
        };
      })
      })();
    });

    function country(cnt, sel) {
      for(var i = 0, l = cnt.length; i < l; i++) {
        if(cnt[i].id == sel.value) {return cnt[i];}
      }
    };

  };
  </script>
</body>
</html>