

Class on April 24 2019
Project 1 Presentations
We performed critiques for the second half of the students. As another example of a mid-term project, take a look at this student's project which is rendered below in three images. The home page includes a navigation bar to the other two pages (Global Trends and Country Trends) included in the submission: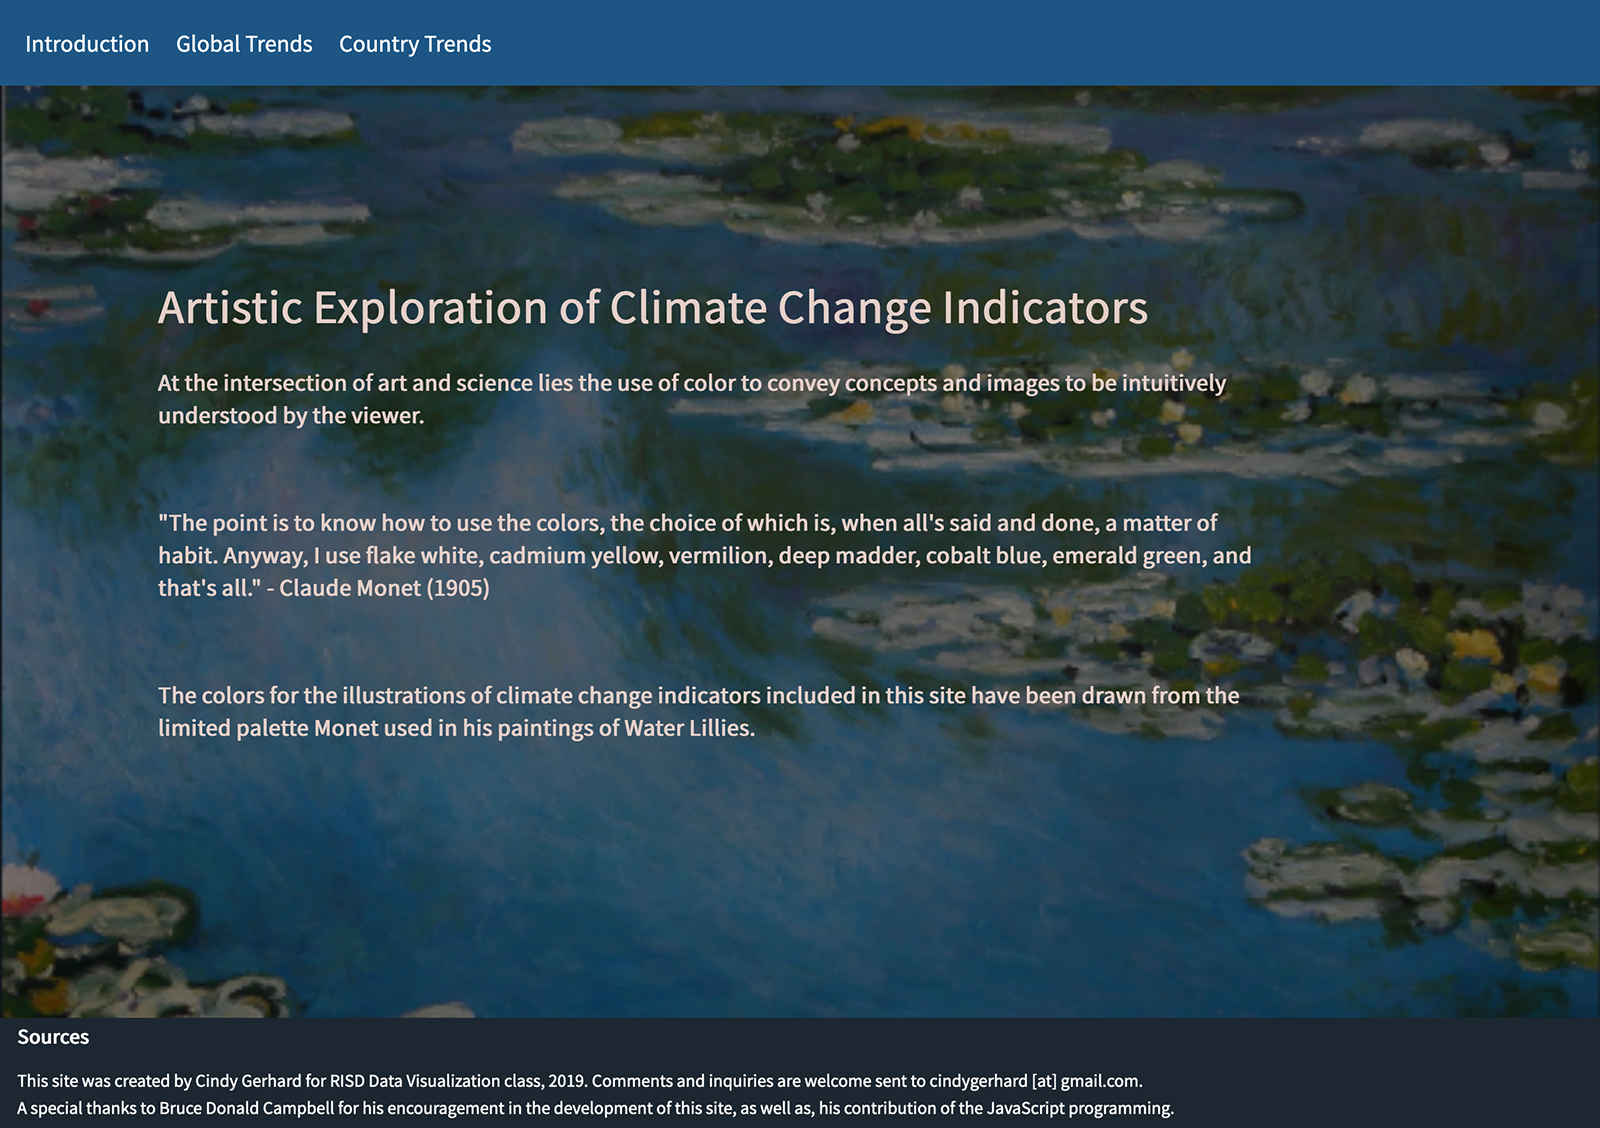
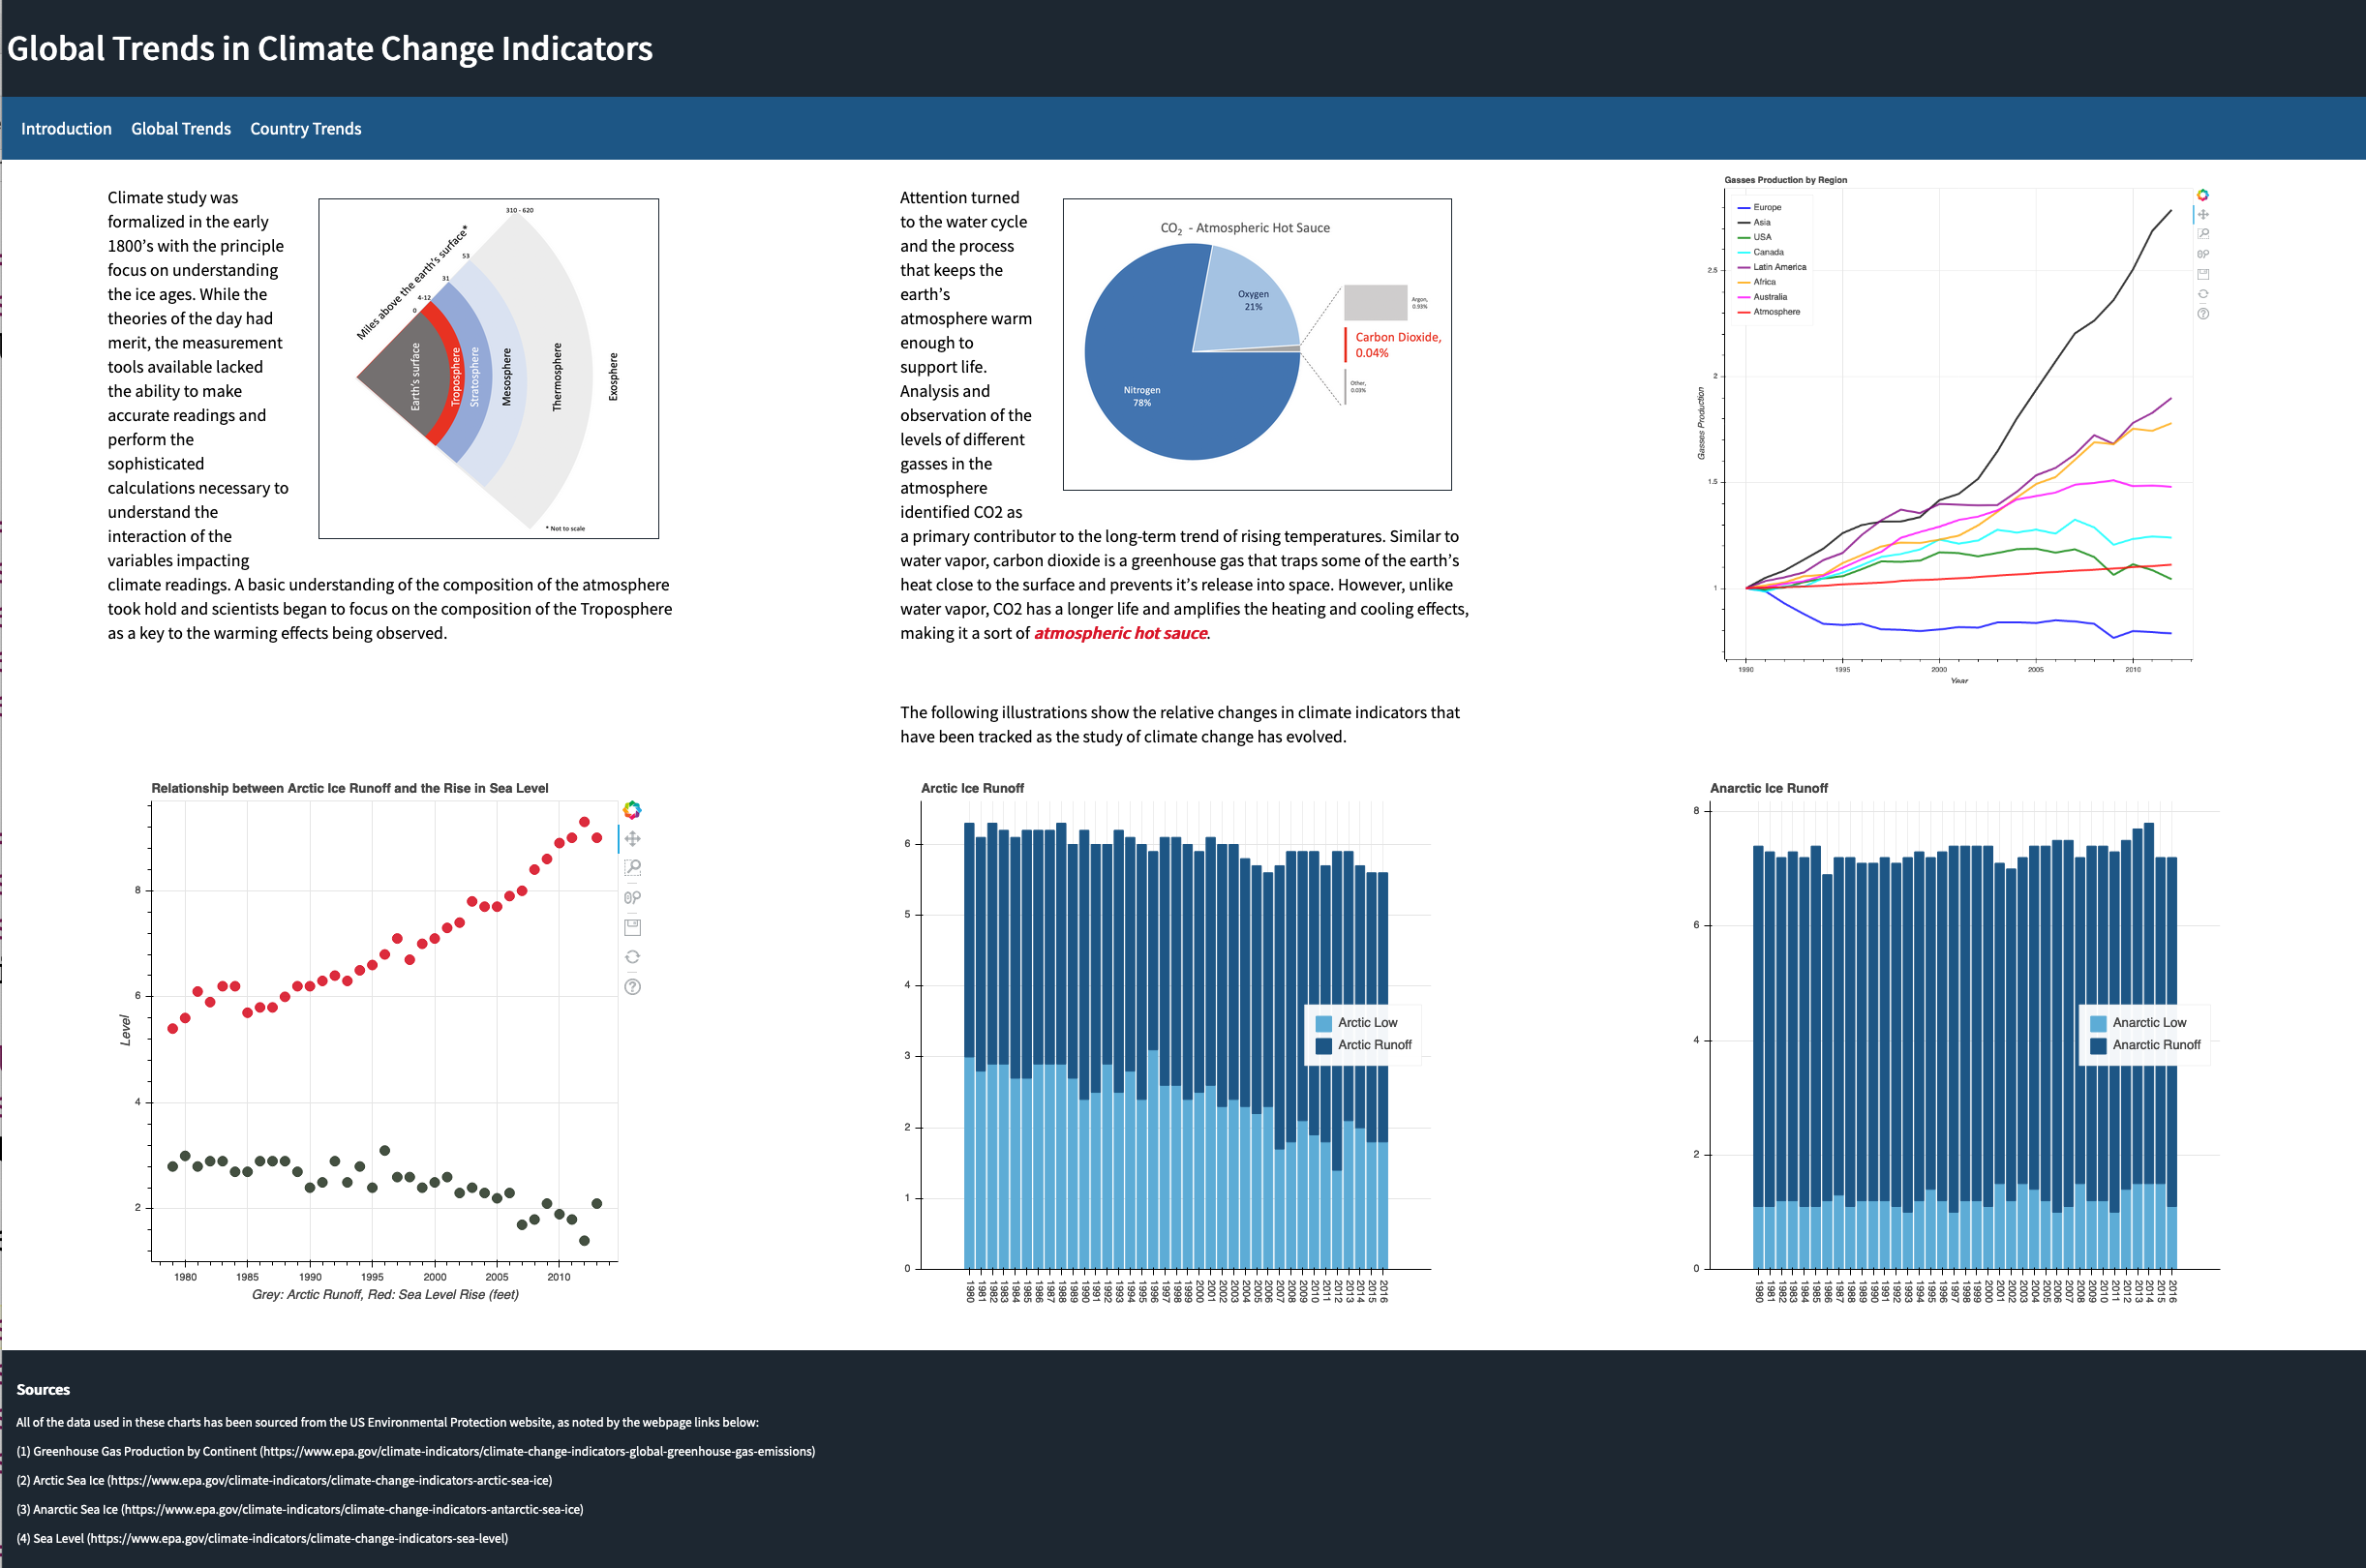
The Global Trends page contains a couple of images and various Bokeh generated info graphics on climate change data (referenced at the bottom of the page), inserted into an attractive HTML5 Flexbox layout.
The Country Trends page includes an interactive map that renders CO2 emissions data by country over 40 years. Clicking on the Show Map Data button loads the most current year's data on the map (the lighter the blue hue, the more the CO2 production by that country).
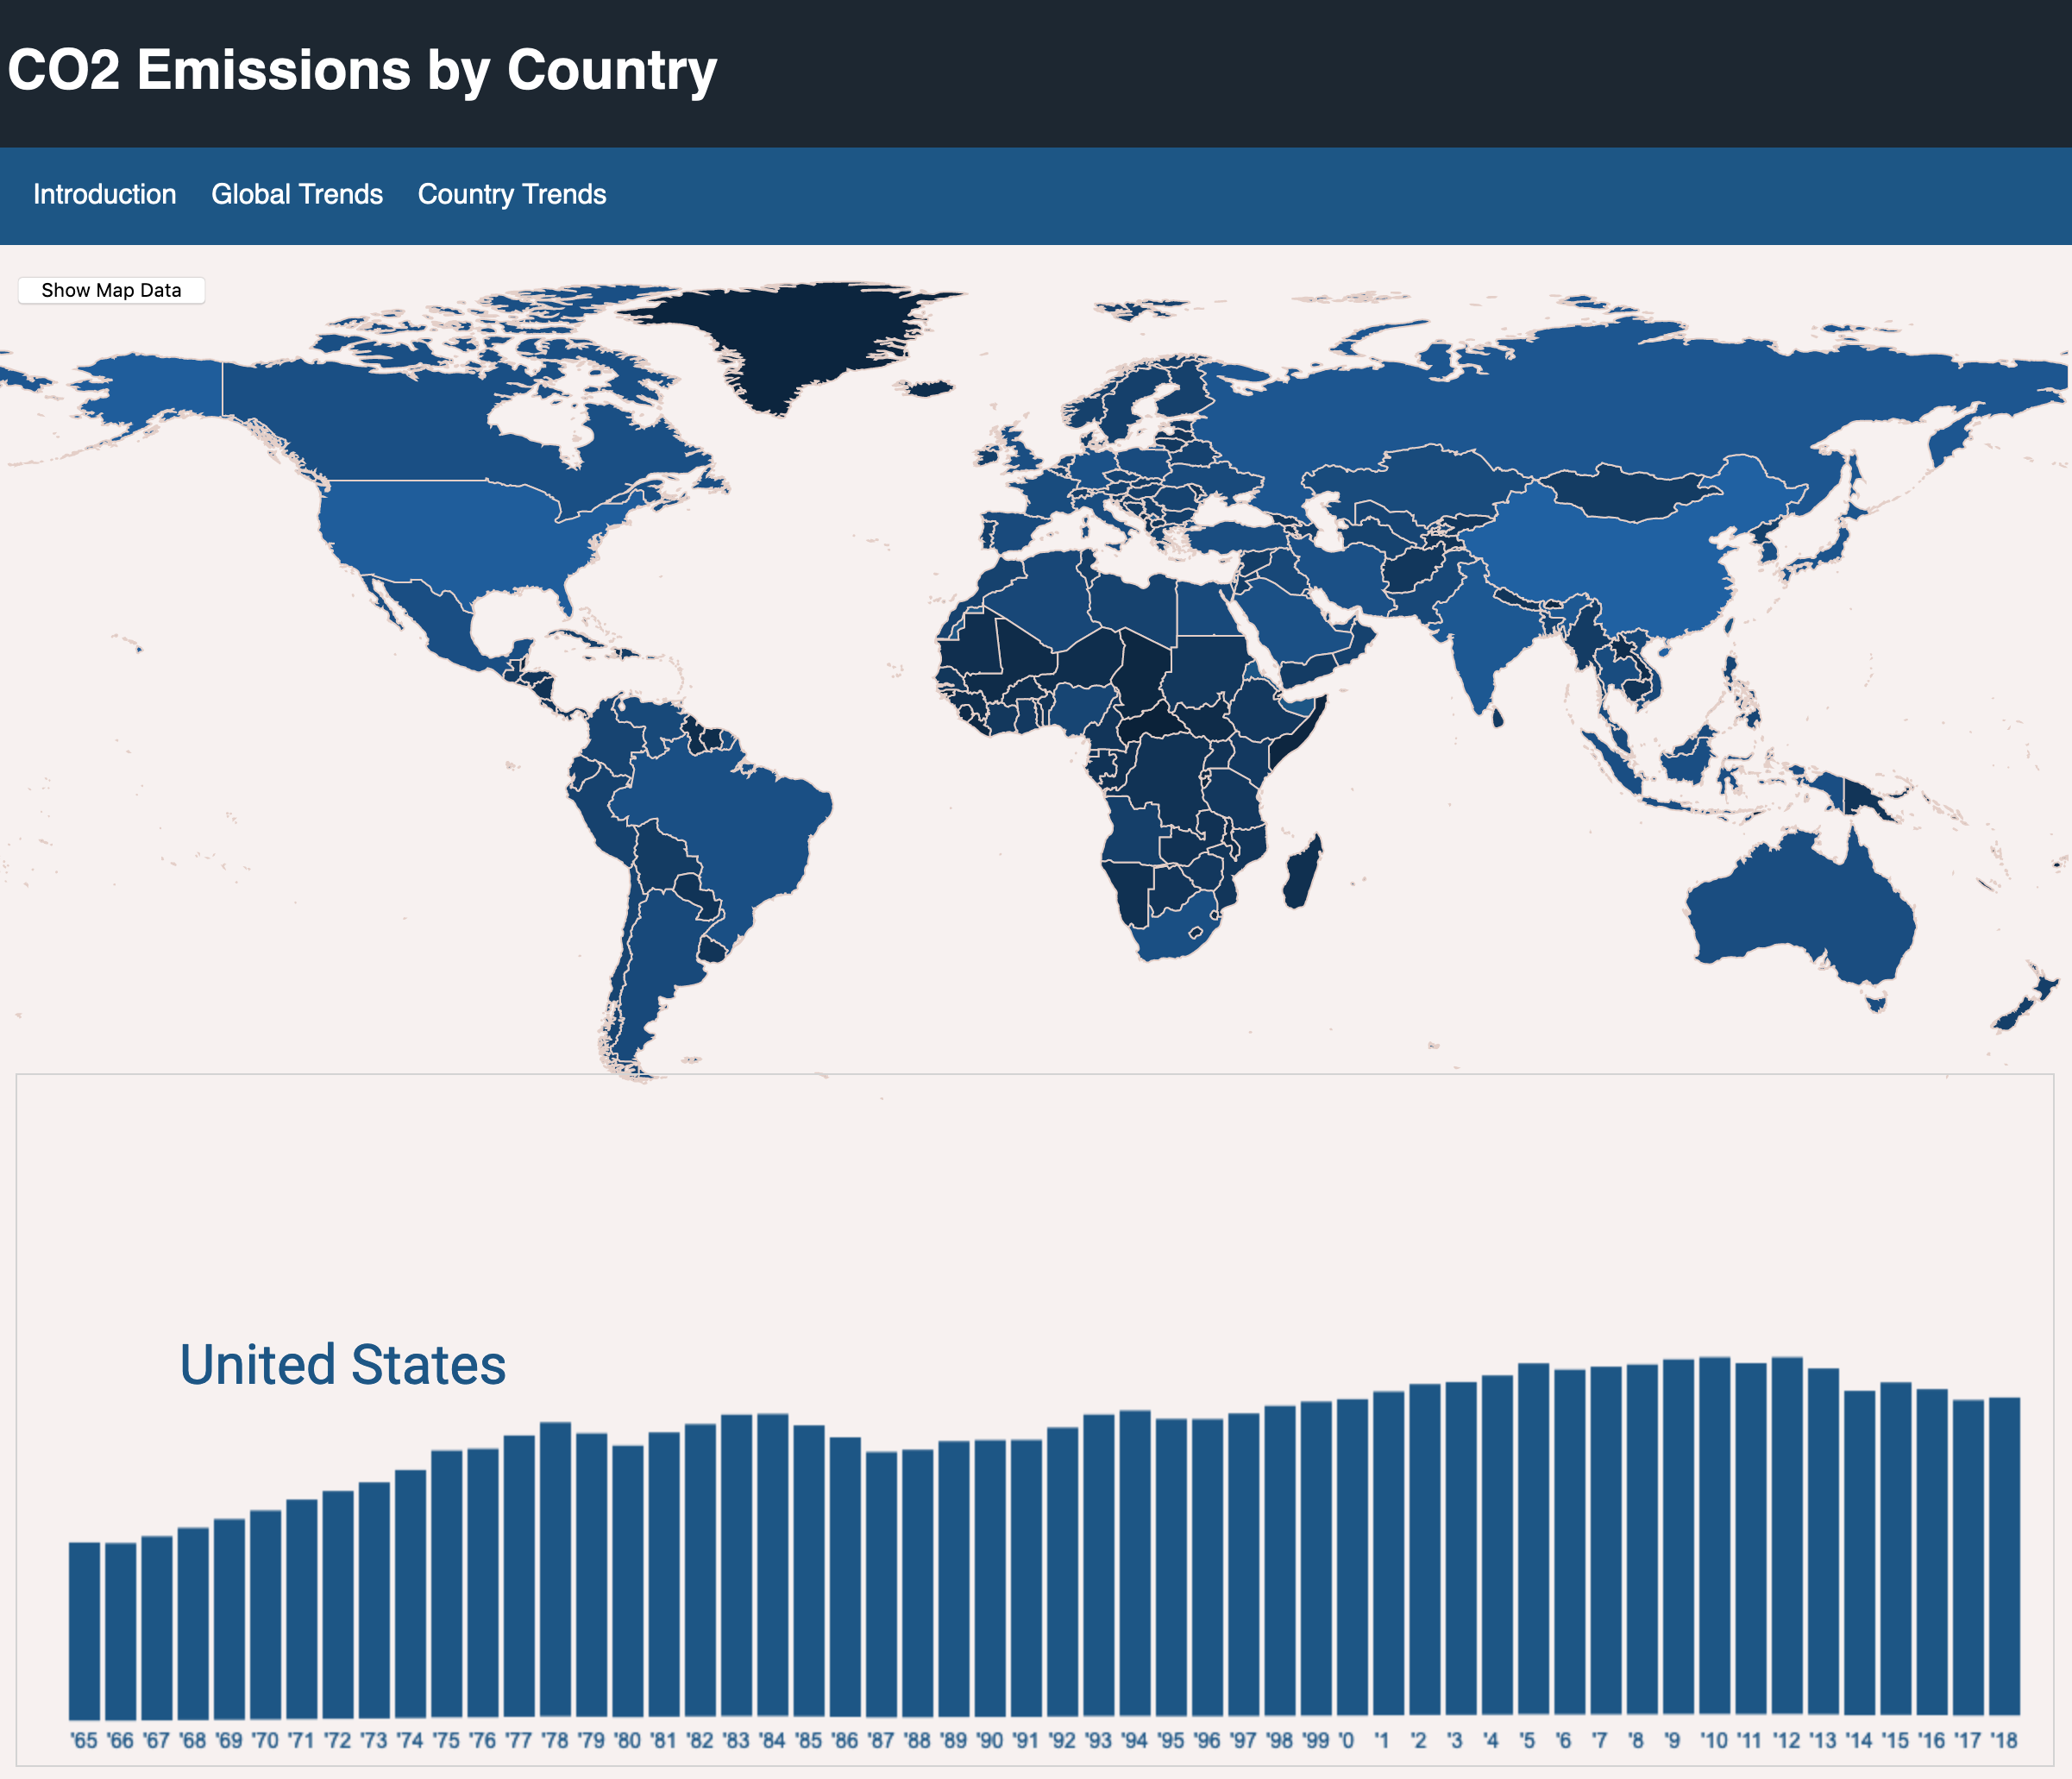
Mousing over a country shows a bar chart of production by year, created with JavaScript code:
function showBarChart(country) {
	var c = document.getElementById("myCanvas");
	var ctx = c.getContext("2d");
	ctx.clearRect(0, 0, 1180, 400);
	for(i=0;i<=250;i++) {
	     if(countryById[i]==country) {
            	ctx.fillStyle = "rgb(29, 86, 133)";
		for(y=0;y<54;y++) {
		    ctx.fillRect(
                          30+(21*y),
                          378-(dataByYear[i][y]/27000000),
                          18,
                          dataByYear[i][y]/28000000
                    );
		    ctx.stroke();
		    ctx.font = "12px Arial";
		    if(y<35) {
		      ctx.fillText("'"+(65+y), 31+21*y, 390);
		    } else {
		      ctx.fillText("'"+(y-35), 31+21*y, 390);
		    }
		}
	    }
	}
}
Student were encouraged to move on to final projects using data and a visualization pipeline of their own choosing.