

Class on May 13 2019
Processing to create visual analytics applications
Processing is a powerful visual programming language that has a useful Processing.js implementation in JavaScript (facilitating use in web browsers). Students considered the use of Processing for visual analytics as a case study from one student's sound data analysis being performed in Python. The student created a Python scatter plot using matplotlib in a Jupyter Notebook. The data is proprietary and could not be shared outside of class (but the CSV format allowed for a timestamp as the first value and five other values that followed from different sound frequencies in hertz).The result was a chart that looked like:
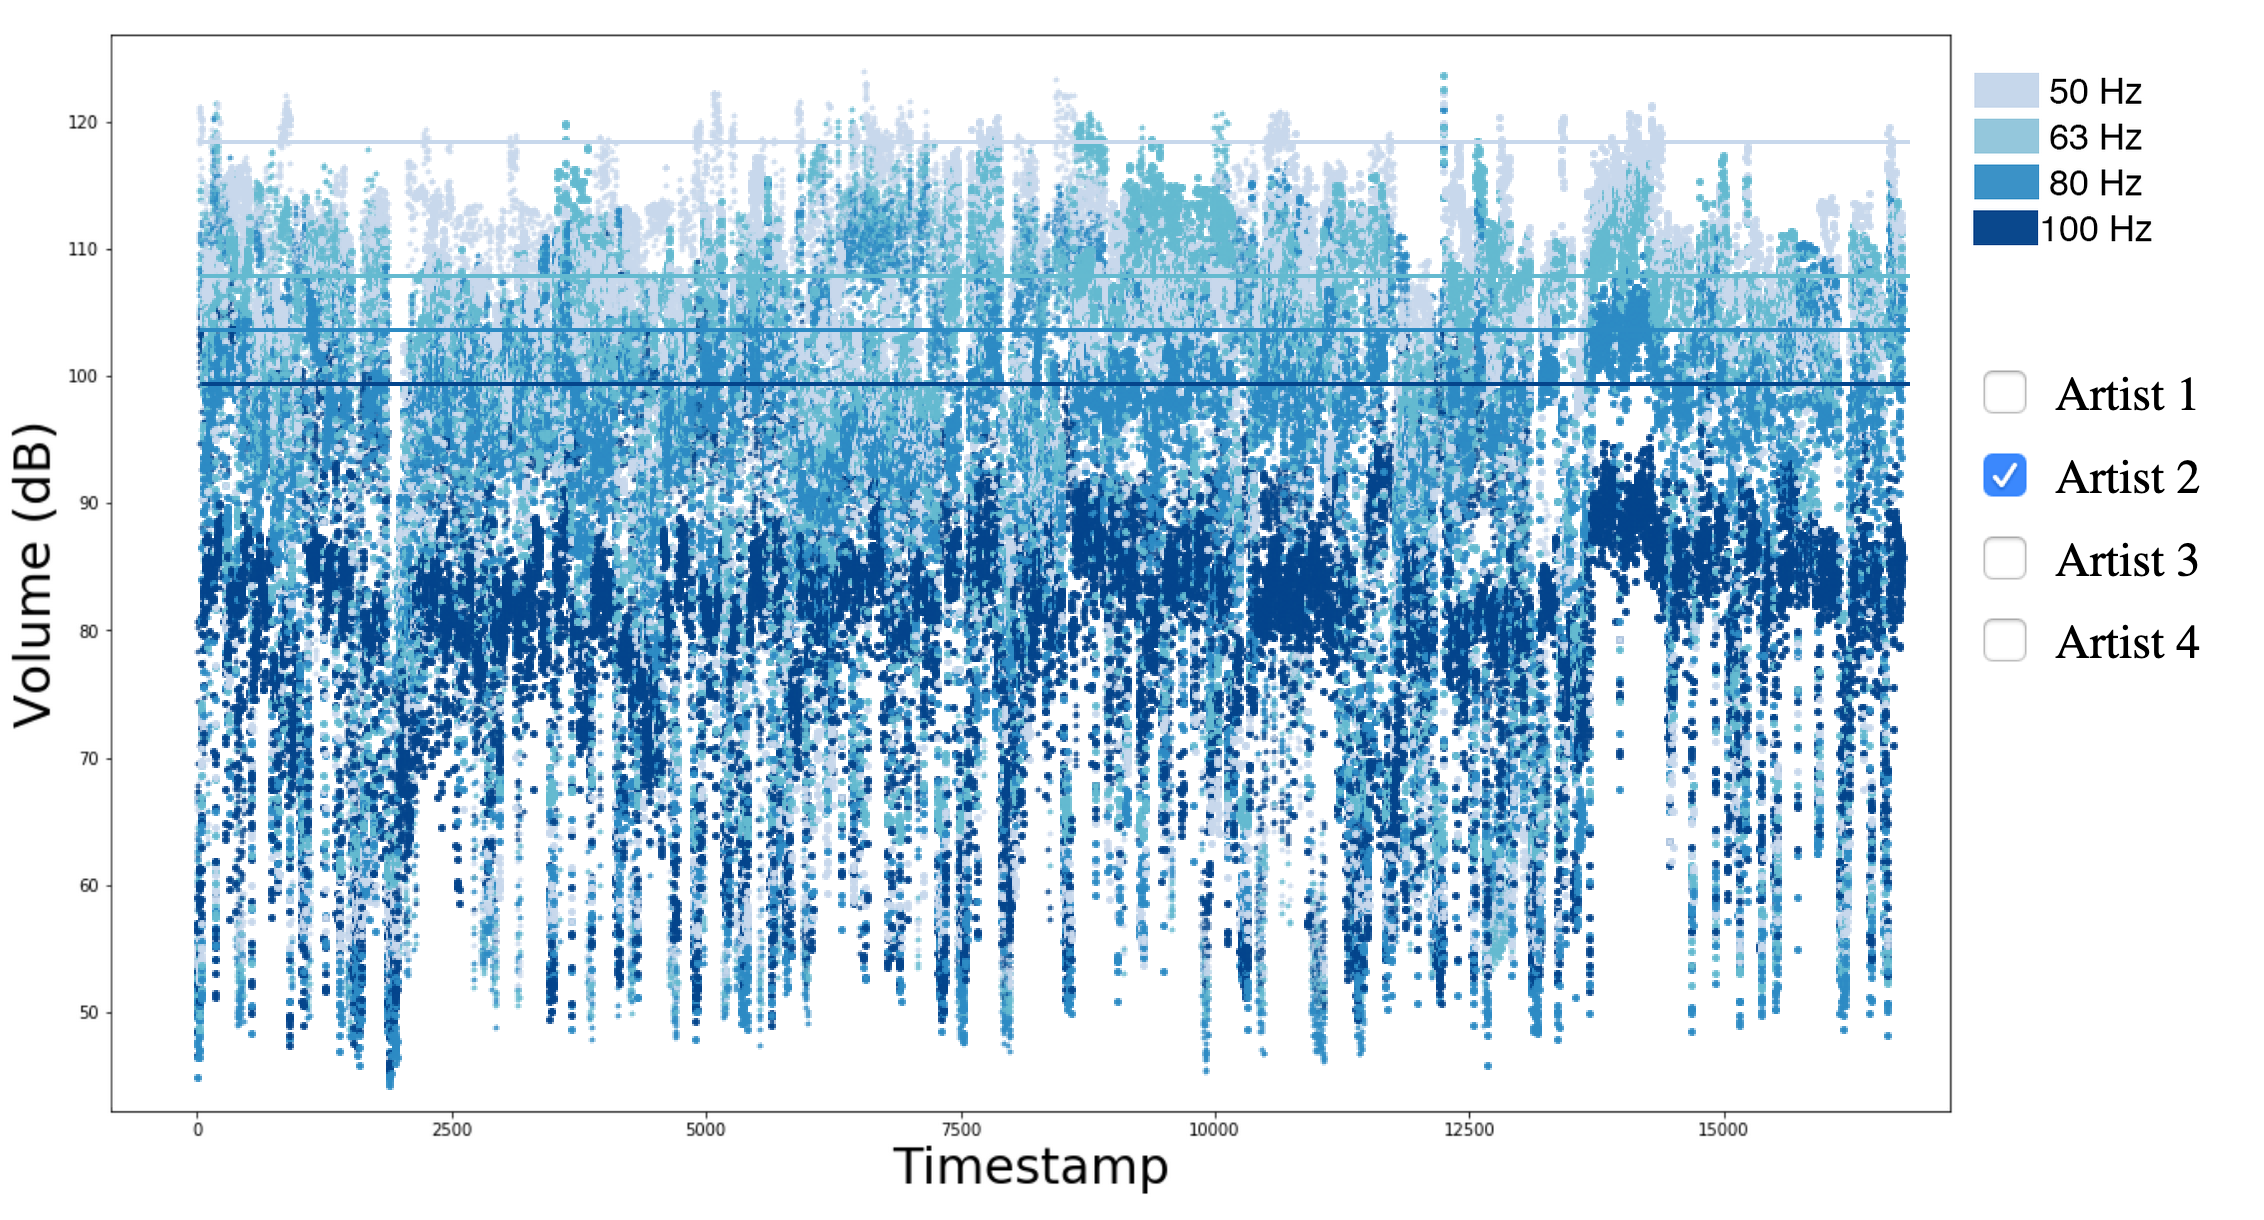
The notebook cell that generated the visual output had Python code:
plt.figure(figsize=(20, 12))
plt.scatter(time, d1, c='#bdc9e1', s=10, alpha=0.75)
plt.scatter(time, d2, c='#74a9cf', s=10, alpha=0.75)
plt.scatter(time, d3, c='#2b8cbe', s=10, alpha=0.75)
plt.scatter(time, d5, c='#045a8d', s=10, alpha=0.75)

x_number_values = [0, 16000]
y_number_values = [118, 118]
plt.plot(x_number_values, y_number_values, linewidth=3, c='#bdc9e1')

x_number_values = [0, 16000]
y_number_values = [108, 108]
plt.plot(x_number_values, y_number_values, linewidth=3, c='#74a9cf')

x_number_values = [0, 16000]
y_number_values = [104, 104]
plt.plot(x_number_values, y_number_values, linewidth=3, c='#2b8cbe')

x_number_values = [0, 16000]
y_number_values = [100, 100]
plt.plot(x_number_values, y_number_values, linewidth=3, c='#045a8d')

plt.xlabel("Timestamp", fontsize=30)
plt.ylabel("Volume (dB)", fontsize=30)
which the student began to convert using the Python Bokeh library we had studied in class. Bokeh makes for nice, efficient, chart creation but generates each chart as a separate HTML file
output. JavaScript provides a nice programming language for creating charts through the HTML5 canvas facility (available in any HTML5-compliant browser). JavaScript can be extended by the
Processing language by adding the processing.js library to an HTML page (through an external URL or through a relative URL if the processing.js library file is included with the HTML file:
<script type="text/javascript" src="processing.js"></script>Processing is a very popular language at art and design schools because it facilitates writing code from the perspective of many formal artistic training approaches. Processing code can be developed within any Processing capable application and then can be ported to JavaScript use by placing it in a text file with a .PDE extention. In the case of our tutorial:
<canvas id="sketch1" data-processing-sources="soundsketch.pde">We can pass data from JavaScript to Processing by way of built-in Processing routines. For example if we create a data variable like:
var data = [
[1, 21.4, 22.9, 46.2],
[1, 24.4, 22.1, 52.2],
[1, 23.4, 22.2, 56.8],
]
in JavaScript, we can pass it to our Processing code via:
for(p=0, end=data.length; p<end; p++) {
  pjs.addPoint(data[p][0], data[p][1], data[p][2], data[p][3]);
}
just by creating a simple addPoint() method in conjunction with a Point class in Processing:
Point addPoint(float a, float b, float c, float d) {
  Point pt = new Point(a,b,c,d);
  points.add(pt);
  return pt;
}

void clearPoints() {
  points = new ArrayList();
}

class Point {
  float a,b,c,d;
  Point(float a, float b, float c, float d) {
      this.a=a; this.b=b; this.c=c; this.d=d;
  }
  void draw() {}
}
Processing contains its own built-in setup() method which we use to set up some overall design interests:
void setup() {
  size(1200,800);
  points = new ArrayList();
  noLoop();
  background(255);
}
And Processing contains its own built-in draw() method which we can use to draw any chart of interest (some example pieces here):
void draw() {
  noFill();
  horiz_compress = 19.2;
  vert_compress  = 6.75;
  for(int i=0; i<(points.size()-1); i++) {
    Point pt = (Point) points.get(i);
    stroke(200, 216, 236);
    ellipse(Math.floor(pt.a/horiz_compress+106),
            Math.floor(980-pt.b*vert_compress),2,2);
  }
  strokeWeight(2);
  stroke(200, 216, 236);
  line(108, 980-118*vert_compress, 960, 980-118*vert_compress);
}
Note the above will draw a point for each row in the data set provided, as well as a threshold line (there are four of these in the image above). We can now build our visual analytics interface
using HTML, CSS, and JavaScript and at any point we can redraw our Processing-managed canvas by calling the draw() method from our own pjs handle (and we can build parameters, such as frequency
hertz, into the application programming interface we wish to design for communications between our application and Processing:
pjs.draw(hertz);Students went through a tutorial where they created an analytical interface for different sound originators and for different frequencies for the sound created. The result was an interactive interface that looked like:
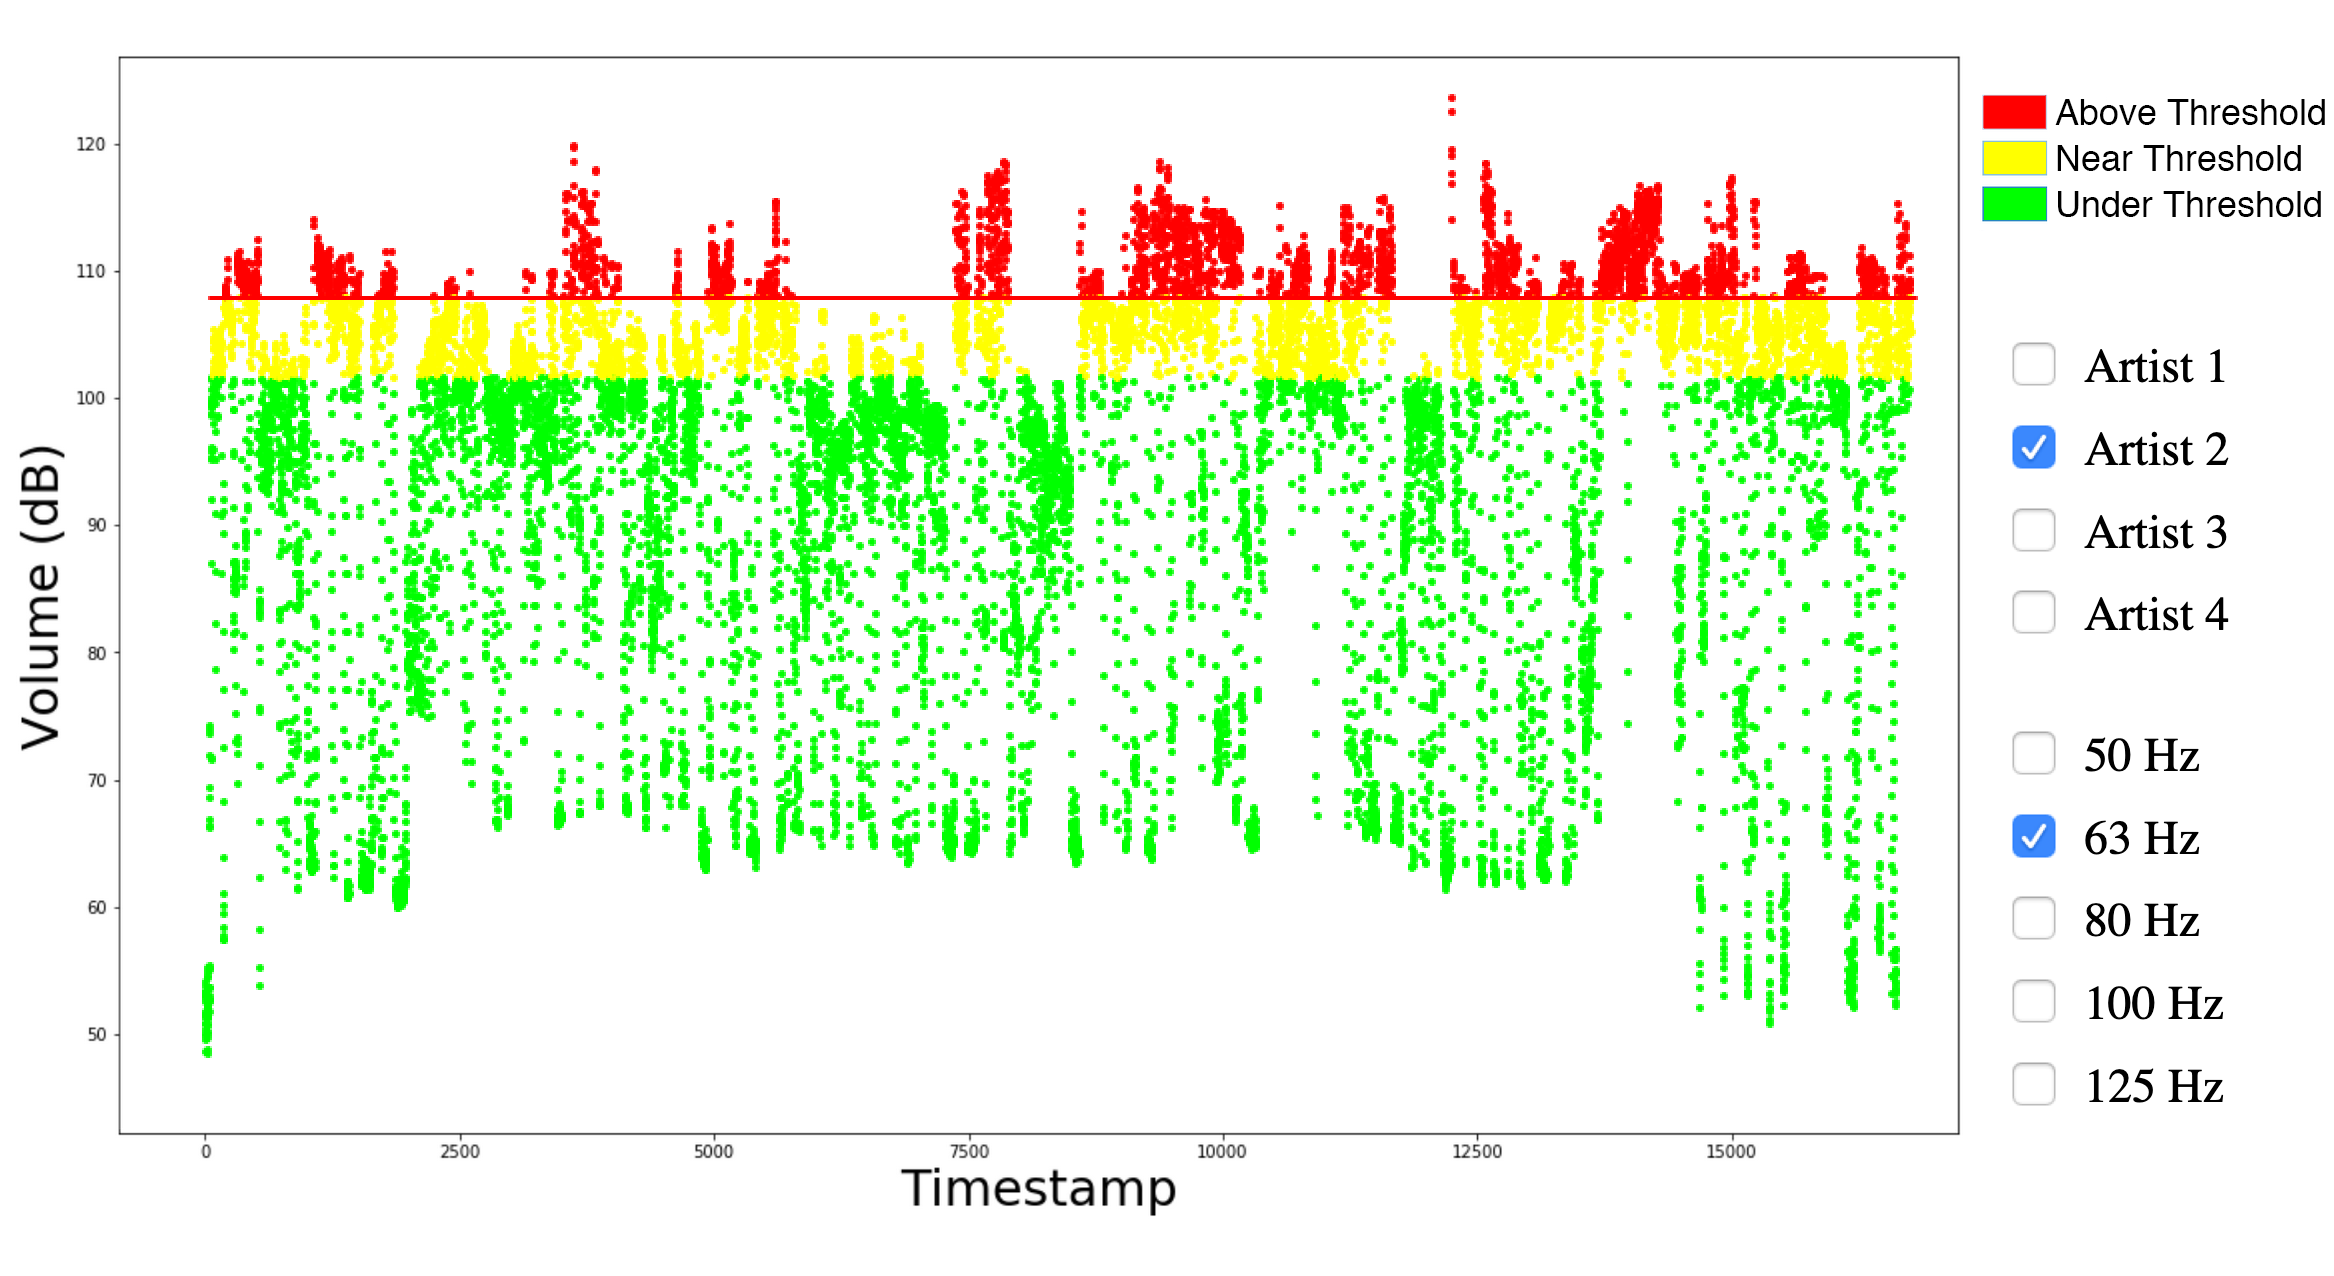
The interface is comprised of an image with transparent regions for the data and interactive checkboxes to appear. Students spent time looking at the HTML document that generated the model and view for the interactive visual analysis application:
<!DOCTYPE html>
<html>
	<head>
		<meta charset="utf-8">
		<title>Sound Analysis</title>
		<script src="http://ajax.googleapis.com/ajax/libs/jquery/1.8.2/jquery.min.js"></script>
		<script type="text/javascript" src="processing.js"></script>
		<script type="text/javascript" src="client1.js"></script>
		<script type="text/javascript" src="client2.js"></script>
		<script type="text/javascript">
        var totals = new Array(0,0,0,0,0,0,0);
		function drawSoundPoints(id, which, data, hertz) {
        	var pjs = Processing.getInstanceById(id);
        	pjs.clearPoints();
        	totals = new Array(0,0,0,0,0,0);
			if(data) {
				// we know the client data is an array of numbers, called "points"
				// as they will be used on scatterplots
				for(p=0, end=data.length; p<end; p++) {
					pjs.addPoint(data[p][0], data[p][1], data[p][2], data[p][3],
						     data[p][4], data[p][5]);
					for (t=0;t<6;t++) {
						totals[t] += data[p][t];
					}
				}
				pjs.addPoint(totals[0], totals[1], totals[2], totals[3], totals[4], totals[5]);
			}
			pjs.draw(hertz);
		}
		var chosen_artist = client1;
		var chosen_hertz = 63;

		function changeArtist(artist, checkbox) {
			setTimeout(function(){ drawSoundPoints('sketch1',0, artist, chosen_hertz); }, 500);
			document.getElementById('artist1').checked = false;
			document.getElementById('artist2').checked = false;
			document.getElementById('artist3').checked = false;
			document.getElementById('artist4').checked = false;
			document.getElementById(checkbox).checked = true;
			chosen_artist = artist;
		}

		function changeHertz(hertz, checkbox) {
			setTimeout(function(){ drawSoundPoints('sketch1',0, chosen_artist, hertz); }, 500);
			document.getElementById('hz50').checked = false;
			document.getElementById('hz63').checked = false;
			document.getElementById('hz80').checked = false;
			document.getElementById('hz100').checked = false;
			document.getElementById('hz125').checked = false;
			document.getElementById(checkbox).checked = true;
			chosen_hertz = hertz;
		}
		setTimeout(function(){ drawSoundPoints('sketch1',0, chosen_artist, chosen_hertz); }, 500);
		</script>
		<style>
		div {
			position:relative;
			float:left;
		}
		#artist1, #artist2, #artist3, #artist4, #hz50, #hz63, #hz80, #hz100, #hz125 {
			height: 32px;
			width: 32px;
			position: relative;
			top: 5px;
		}
		</style>
	</head>
	<body>
		<canvas id="sketch1" data-processing-sources="soundsketch.pde"
			style="position:absolute;top:0;left:0;z-index:1"></canvas>
		<img id="monthly" src="skin.png"
			style="position:absolute;top:120px;left:0px;height:600px;z-index:2" />
		<div id="ui" style="position:absolute;top:260px;left:1000px;height:600px;z-index:2;font-size:24px">
			<input type="checkbox" id="artist1"
				onclick="changeArtist(client1, 'artist1')" /> Artist 1<br/>
			<input type="checkbox" id="artist2"
				onclick="changeArtist(client2, 'artist2')" /> Artist 2<br/>
			<input type="checkbox" id="artist3"
				onclick="changeArtist(client3, 'artist3')" /> Artist 3<br/>
			<input type="checkbox" id="artist4"
				onclick="changeArtist(client4, 'artist4')" /> Artist 4<br/><br/>
			<input type="checkbox" id="hz50"
				onclick="changeHertz(50, 'hz50')" /> 50 Hz<br/>
			<input type="checkbox" id="hz63"
				onclick="changeHertz(63, 'hz63')" /> 63 Hz<br/>
			<input type="checkbox" id="hz80"
				onclick="changeHertz(80, 'hz80')" /> 80 Hz<br/>
			<input type="checkbox" id="hz100"
				onclick="changeHertz(100, 'hz100')" /> 100 Hz<br/>
			<input type="checkbox" id="hz125"
				onclick="changeHertz(125, 'hz125')" /> 125 Hz<br/>
		</div>
		<p id=out></p>
		<script>
			function getMousePos(canvas, evt) {
			  var rect = canvas.getBoundingClientRect();
			  return {
				  x: evt.clientX - rect.left,
				  y: evt.clientY - rect.top
			  };
			}
			// Converts from degrees to radians.
			Math.radians = function(degrees) {
				return degrees * Math.PI / 180;
			};
			// Converts from radians to degrees.
			Math.degrees = function(radians) {
				return radians * 180 / Math.PI;
			};
		</script>
	</body>
</html>
and were given the data, PDE code, skin.png image, and the processing.js file in order to play with making changes to a working application.
Students were encouraged to consider using Processing for their final projects if other methods they had been considering were looking to be too cumbersome or entail too much tedium to accomplish. Students were reminded to focus on the vocabulary they would use to communicate their project specifications to other programmers as that is always a likely need when working with a new technology requiring help to program.