

Class on May 20 2019
Presentation of final project
Students presented their final projects. For example, the spine alignment visual analytics tool: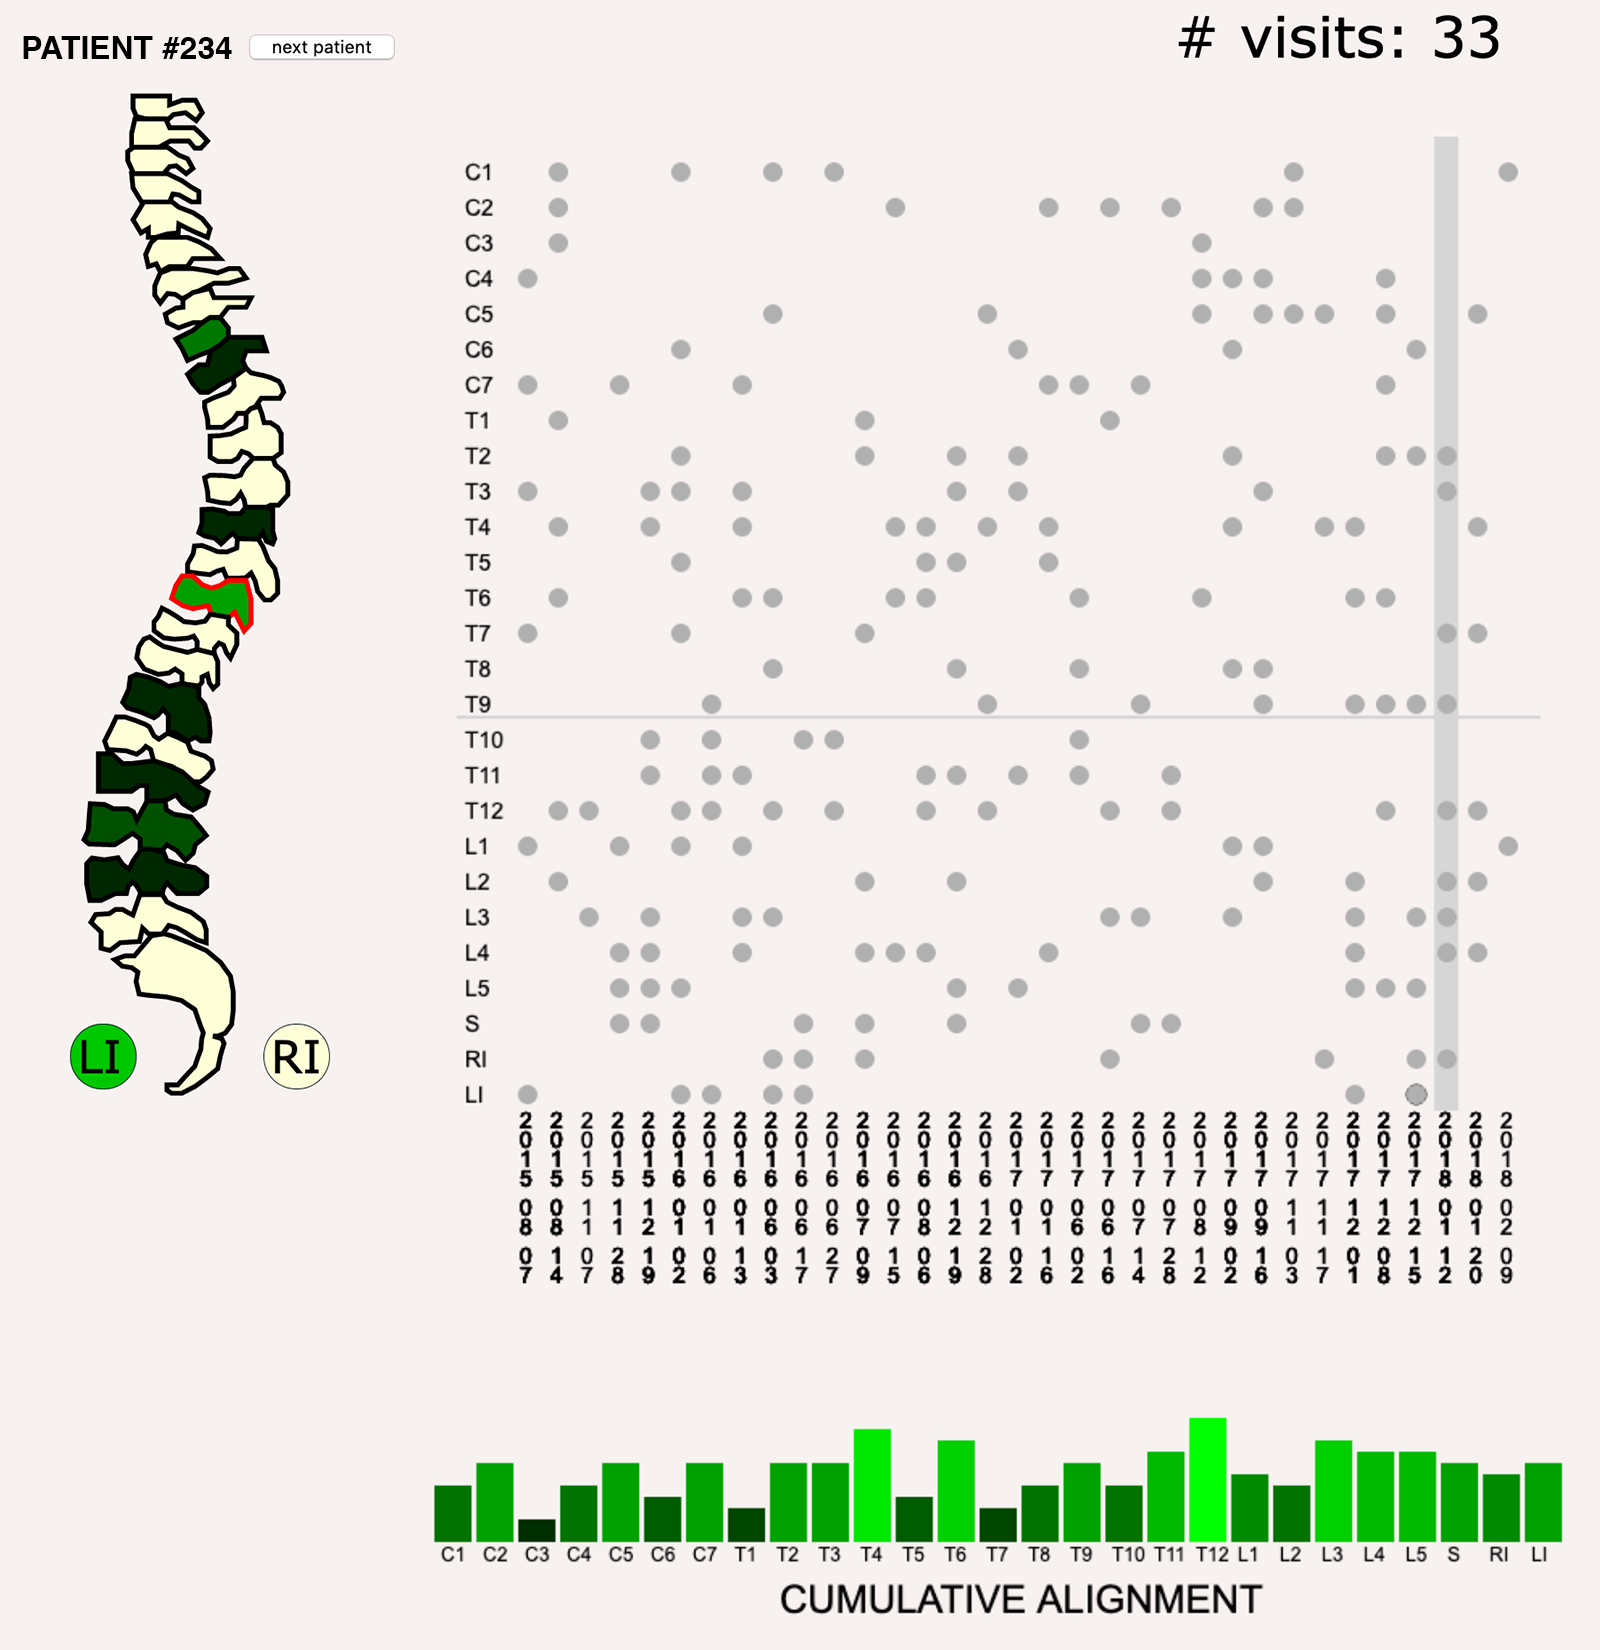
includes three main visual analytics components (and three minor ones that show the current patient number, number of visits they had to the chiropractor so far, and the long name of a vertebra when the mouse is passed over a vertebra on the visual spine component). The visual spine shows data for the vertebrae that were adjusted on the date chosen in the dot plot. One vertebra can be chosen through mouse over on the visual spine component or click on a dot in the dot plot).
The dot plot shows a dot for all alignment events (vertebra alignment by date) and users can click on a dot or date to change the other components based on the selection.
A bar chart shows the cumulative work on each vertebrae through the date chosen (so the plot grows upwards as the user moves from left to right, chronologically, on the dates).
The image below highlights the analytical nature of the tool, where a user has chosen vertebra C5 on 12-26-2016:
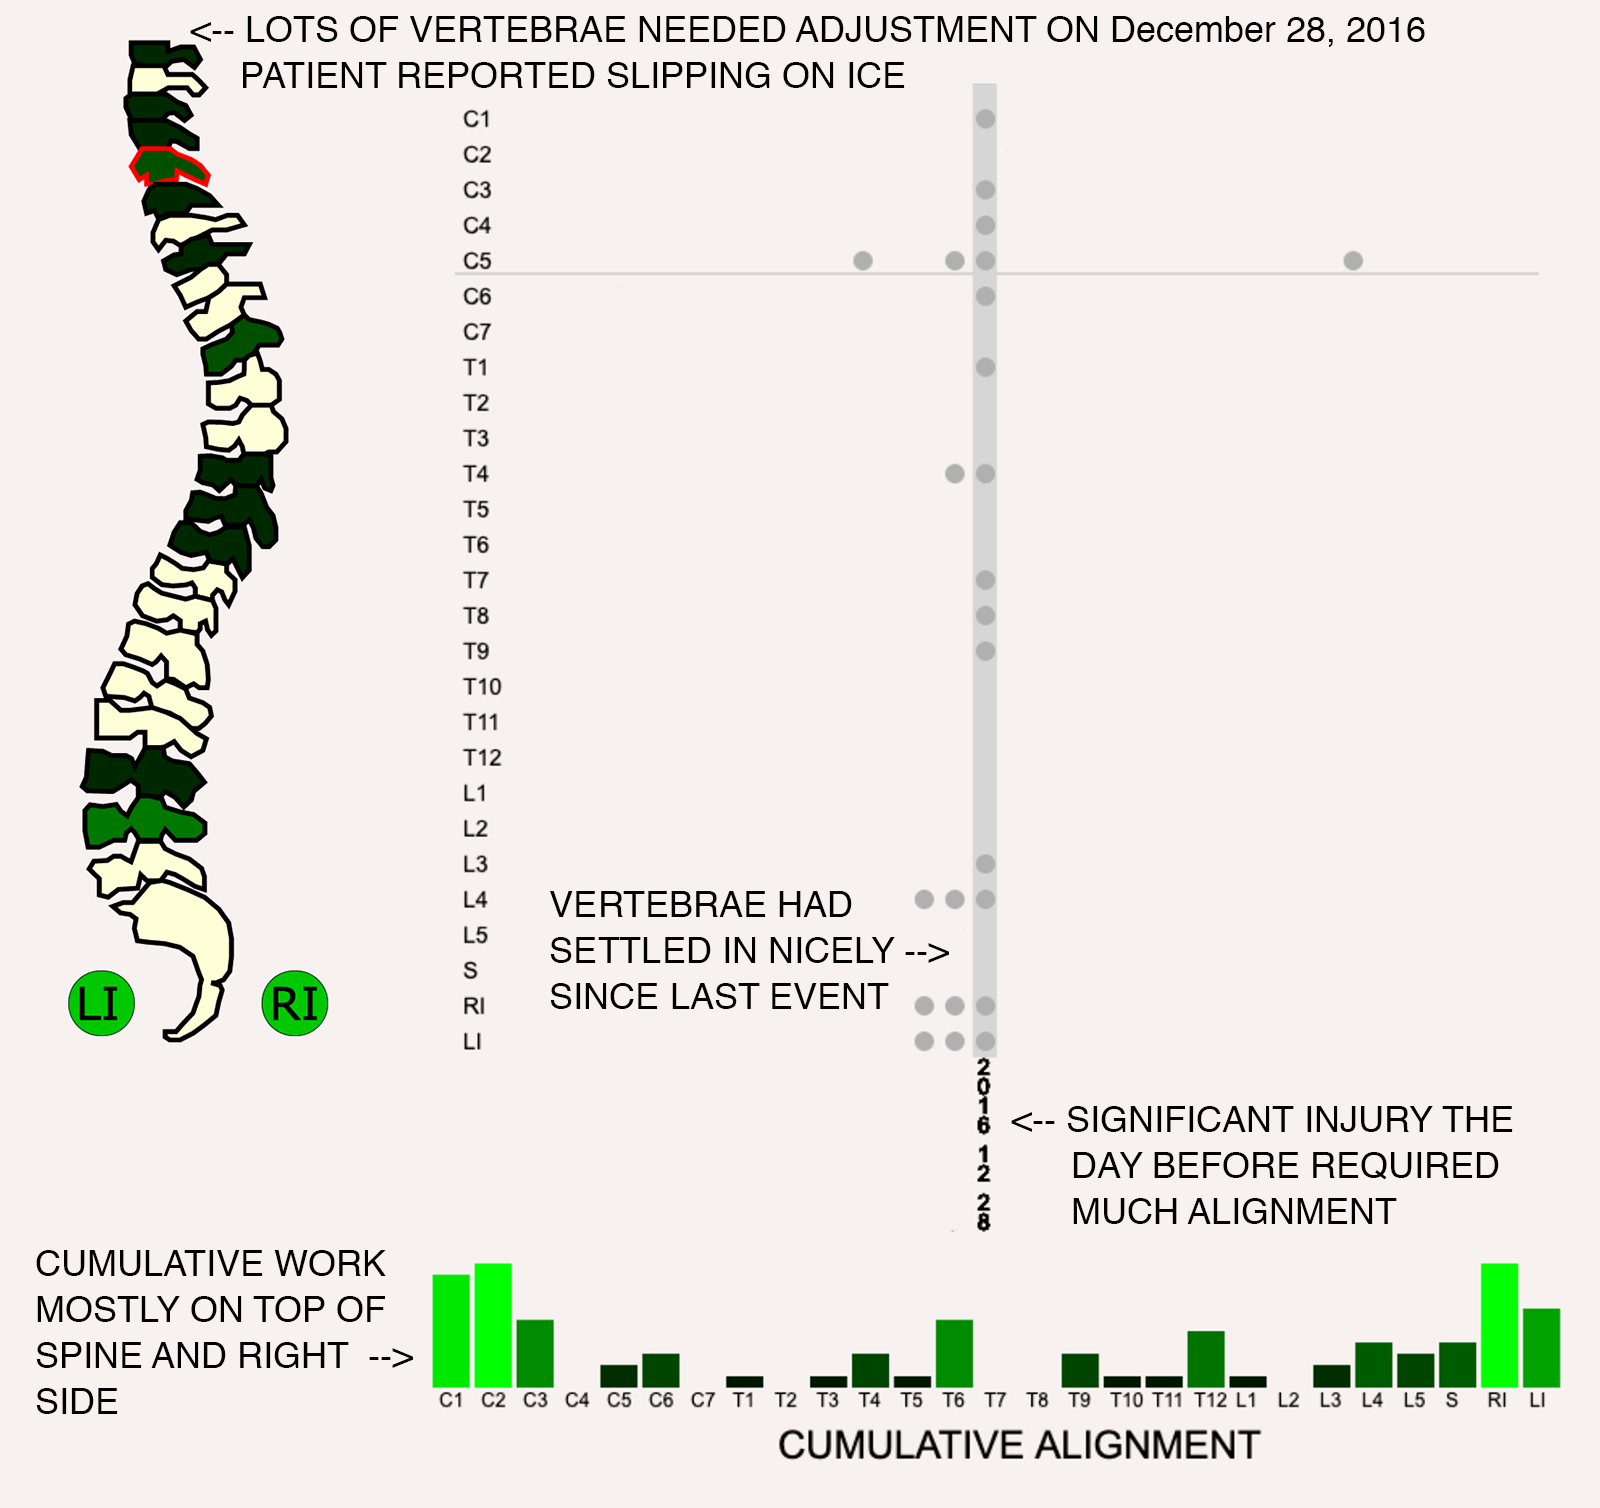
The fill on so many vertebrae in the visual spine suggests a major alignment session with the chiropractor. The fact there are very few consecutive dots prior to that date suggests the spine had been doing well. The cumulative bar chart suggests the event differed from the usual alignment needs as those were typically at the top of the spine and in horizontal adjustments.
Some of the more interesting art decisions are reflect in the code as follows:
The Bar Chart now shows the cumulative work on each vertebra up to and including the current date chosen. The coloring decision is made on line 259 of spine.js:
ctx.fillStyle = 'rgb(0,' + Math.floor(cumulativeTotals[i]*255/count) + ',0)';with the cumulativeTotals being recalculated every time the Bar Chart is updated.
The spine now shows the current vertebra outline stroke in red (the thickening of the border was confusing using a fill ramp that starts with black as minimum). You can play with that wherever you see (you can use strokeWidth = "3" instead, for example):
document.getElementById("vertebra_"+vertebra_chosen).style.stroke = "red";
The spine vertebrae are colored based on how many consecutive visits alignment was performed up to and including the date selected. The code to create that count is here (spine.js lines 208-214):
 consecutive_count = 1;
 index = date-1
 while(data[index][i]==1) {
   consecutive_count = consecutive_count + 1;
   index = index-1;
 }
 document.getElementById("vertebra_"+data[0][i]).style.fill =
                    "rgb(0," + (consecutive_count*40) + ",0)";
with that last line applying the fill color based on the count.
All other smaller changes were made according to consensus from the workshop. We were able to debug a date selection bug (wrong upper limit) and the Sacral processing issue (wrong short-name in the JSON — called it S1 instead of just S).