

Class on March 13 2019
Students considered the work we have done in class in visualizing a basemap for Narragansett Bay bathymetry, with buoy icons and location temperature values, in light of the week's
assigned readings on color and color theory:
Hornung's Seeing Color
Tufte's Chapter 3
Zwimpfer's Color Light Sight Sense
Laidlaw's Visualization Viewpoint
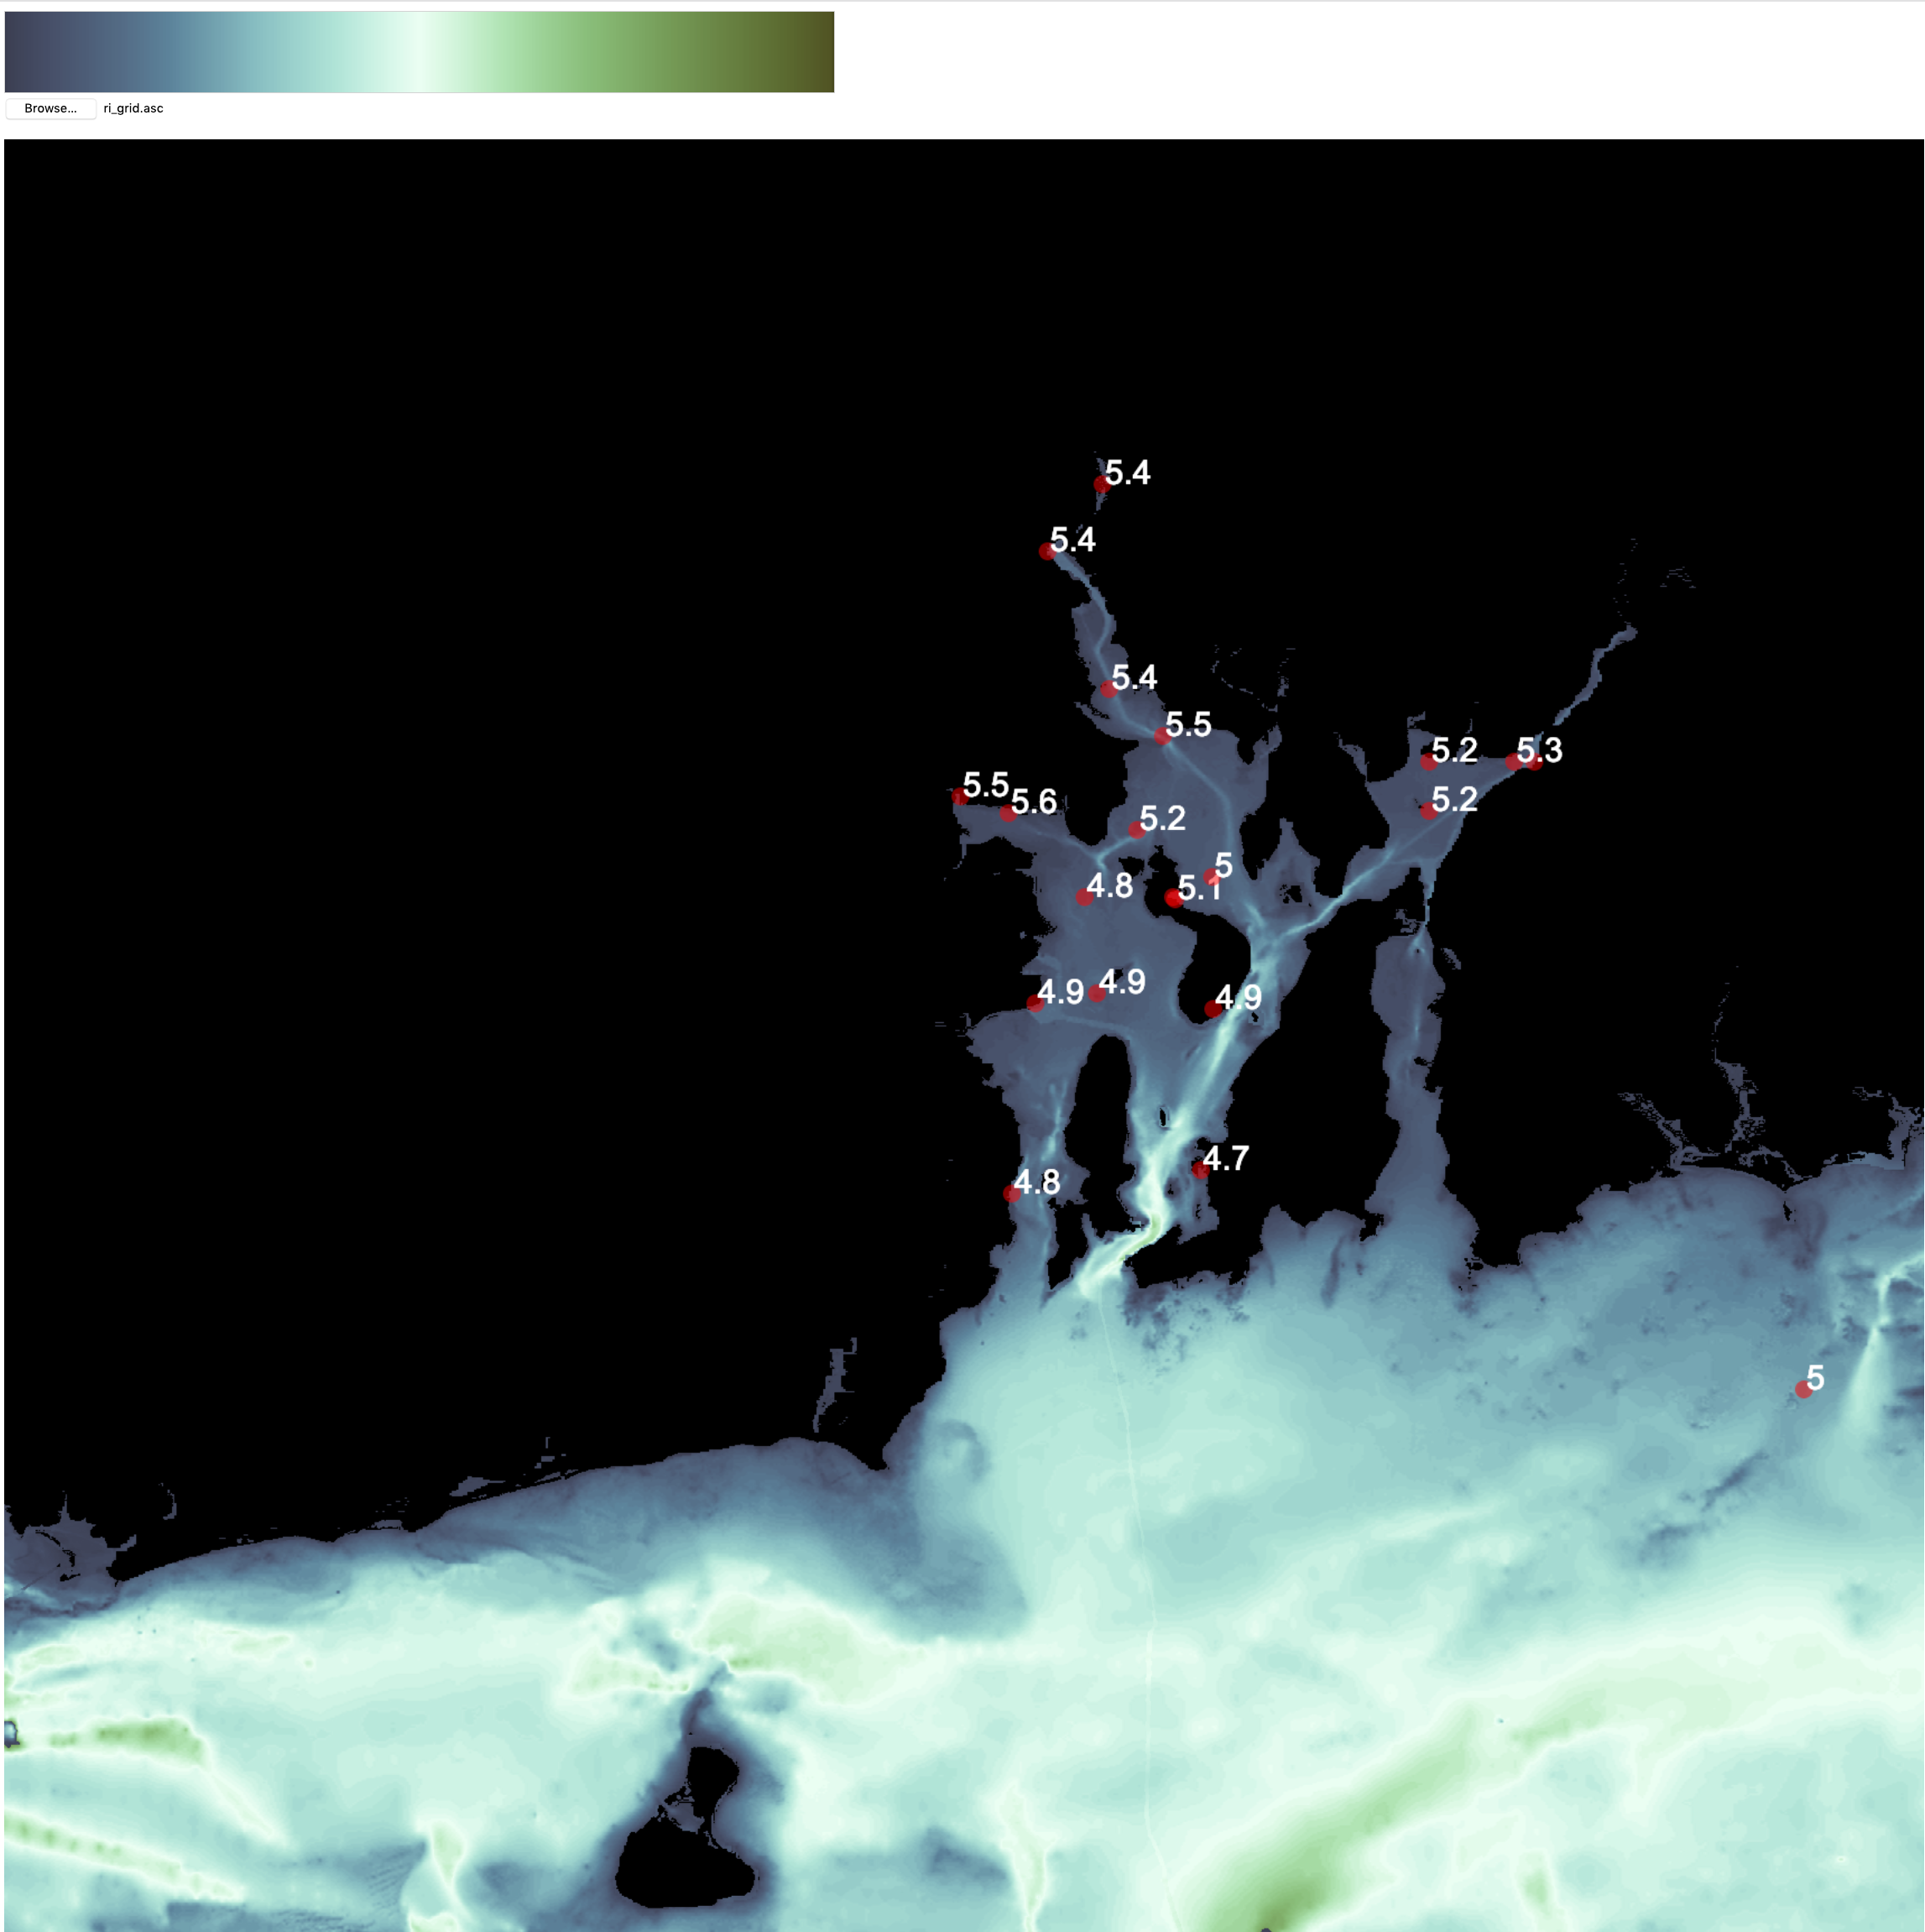
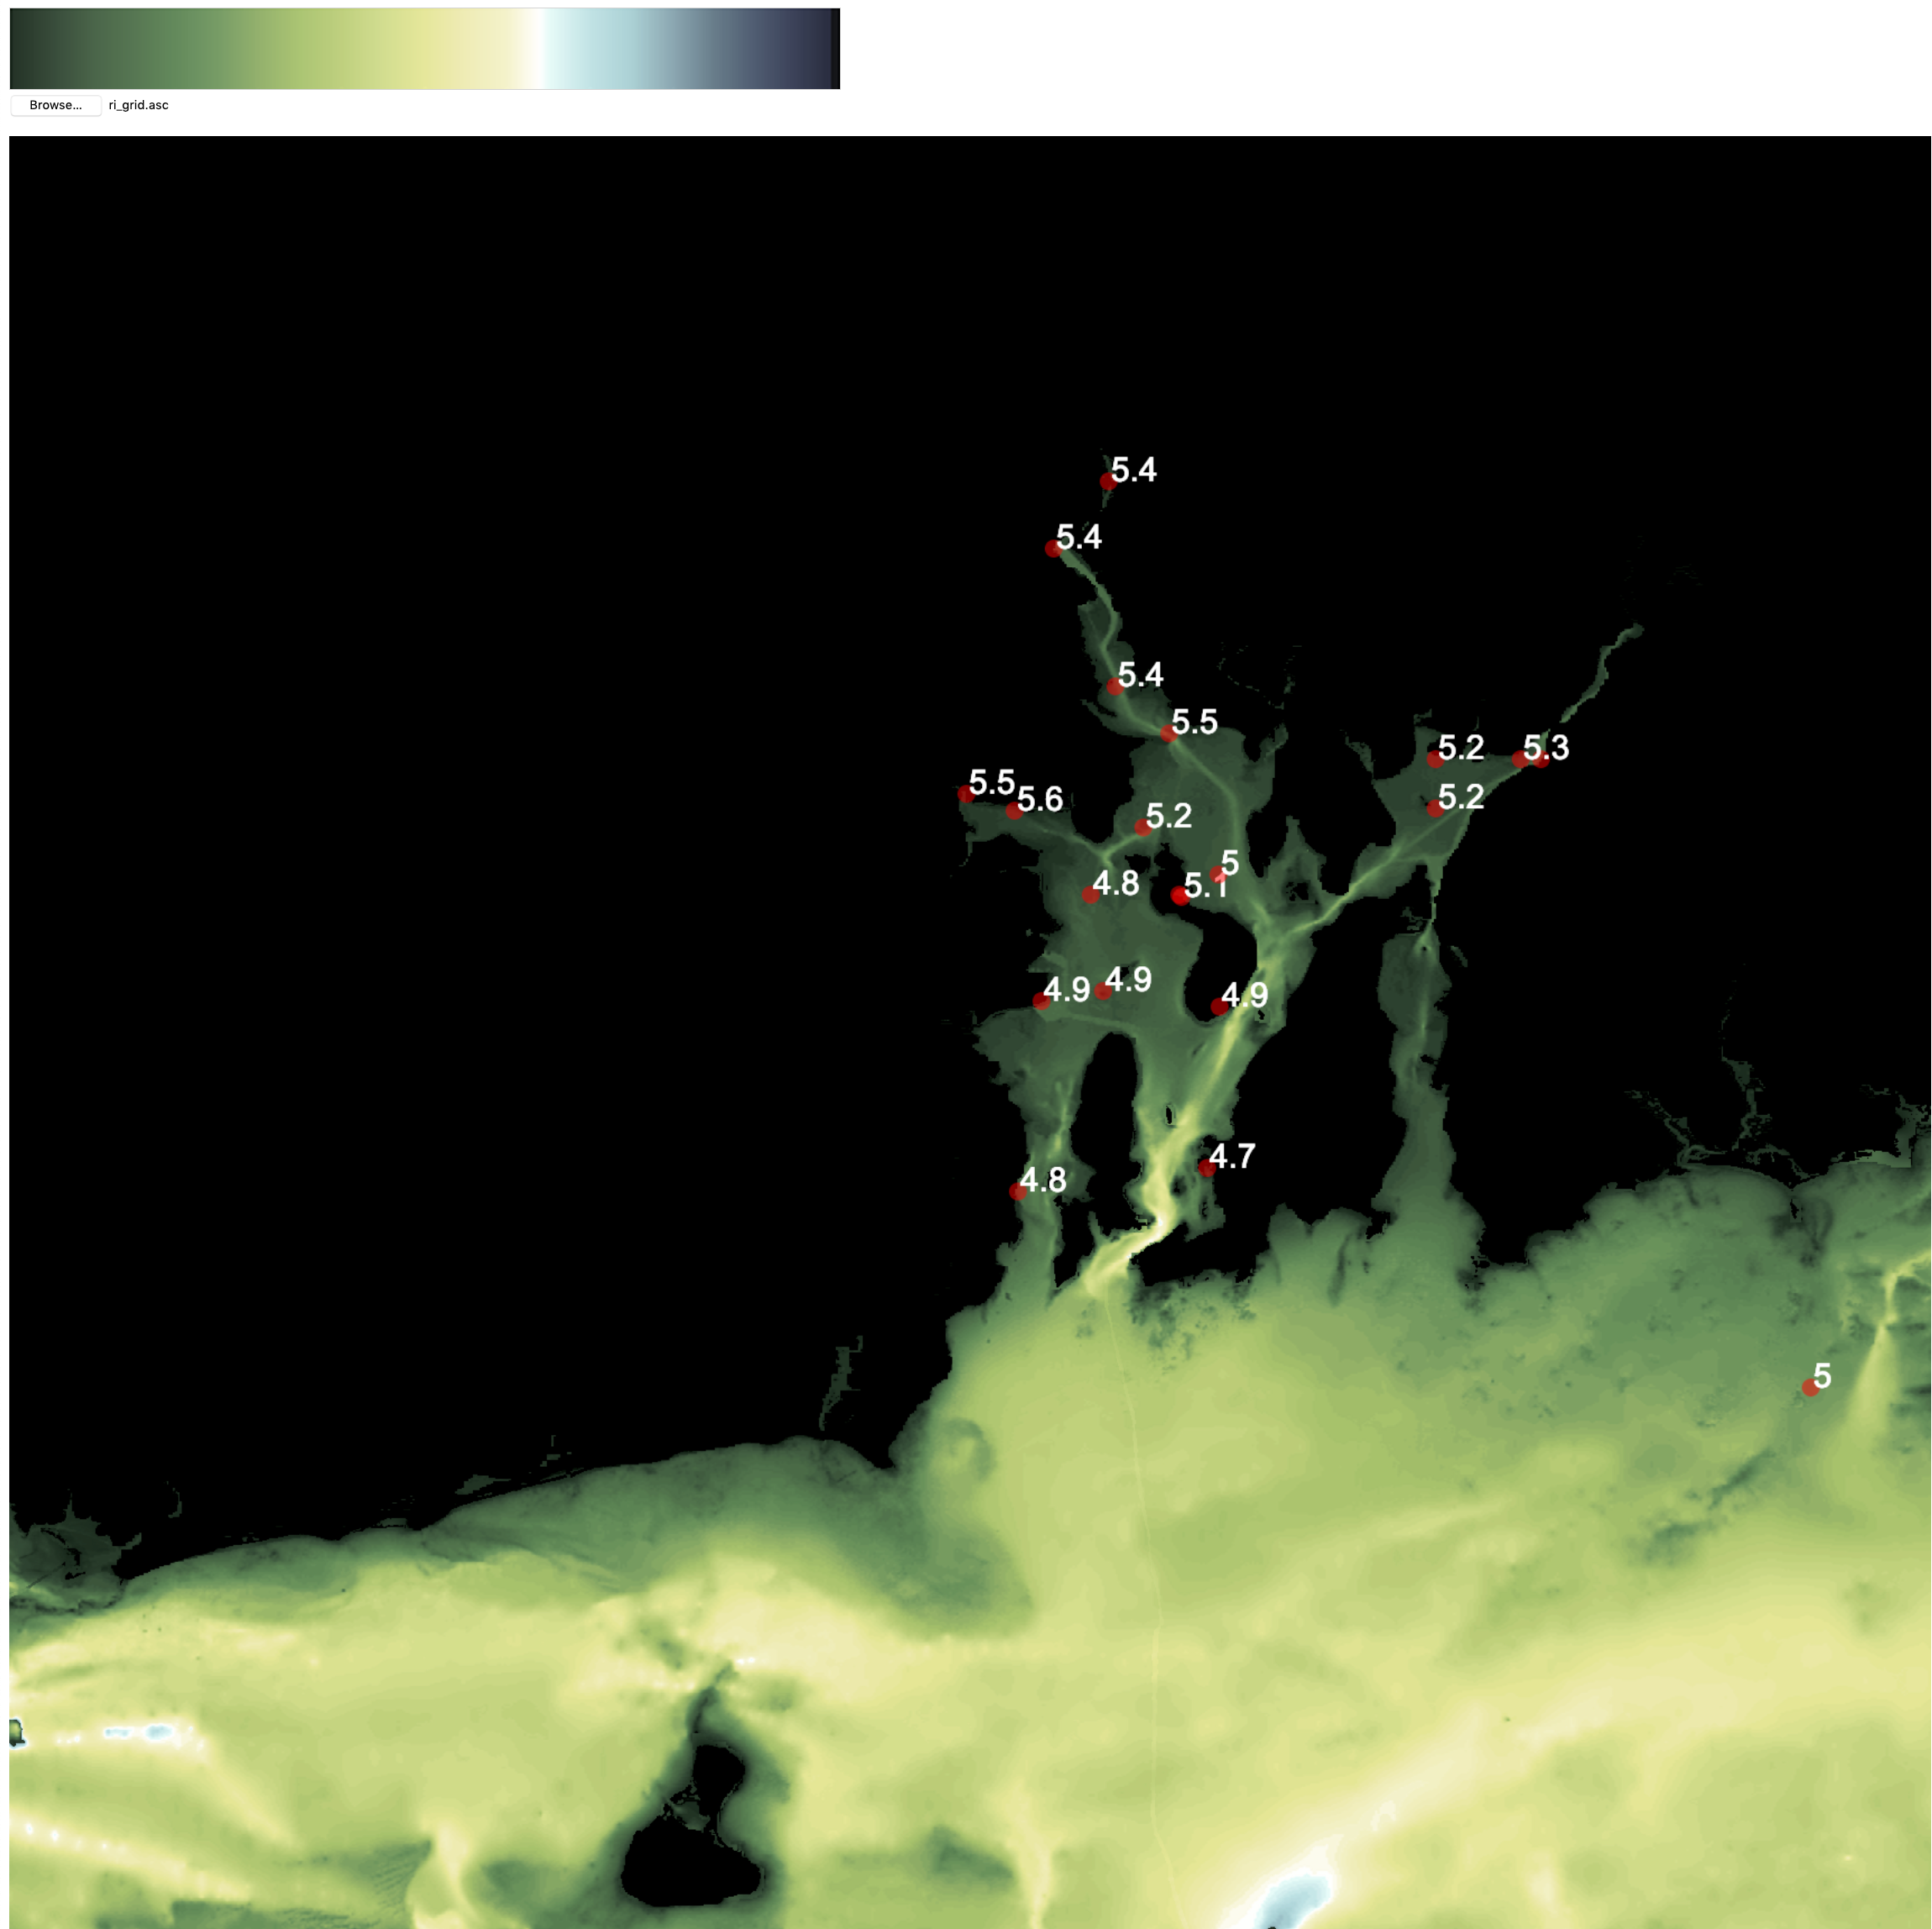
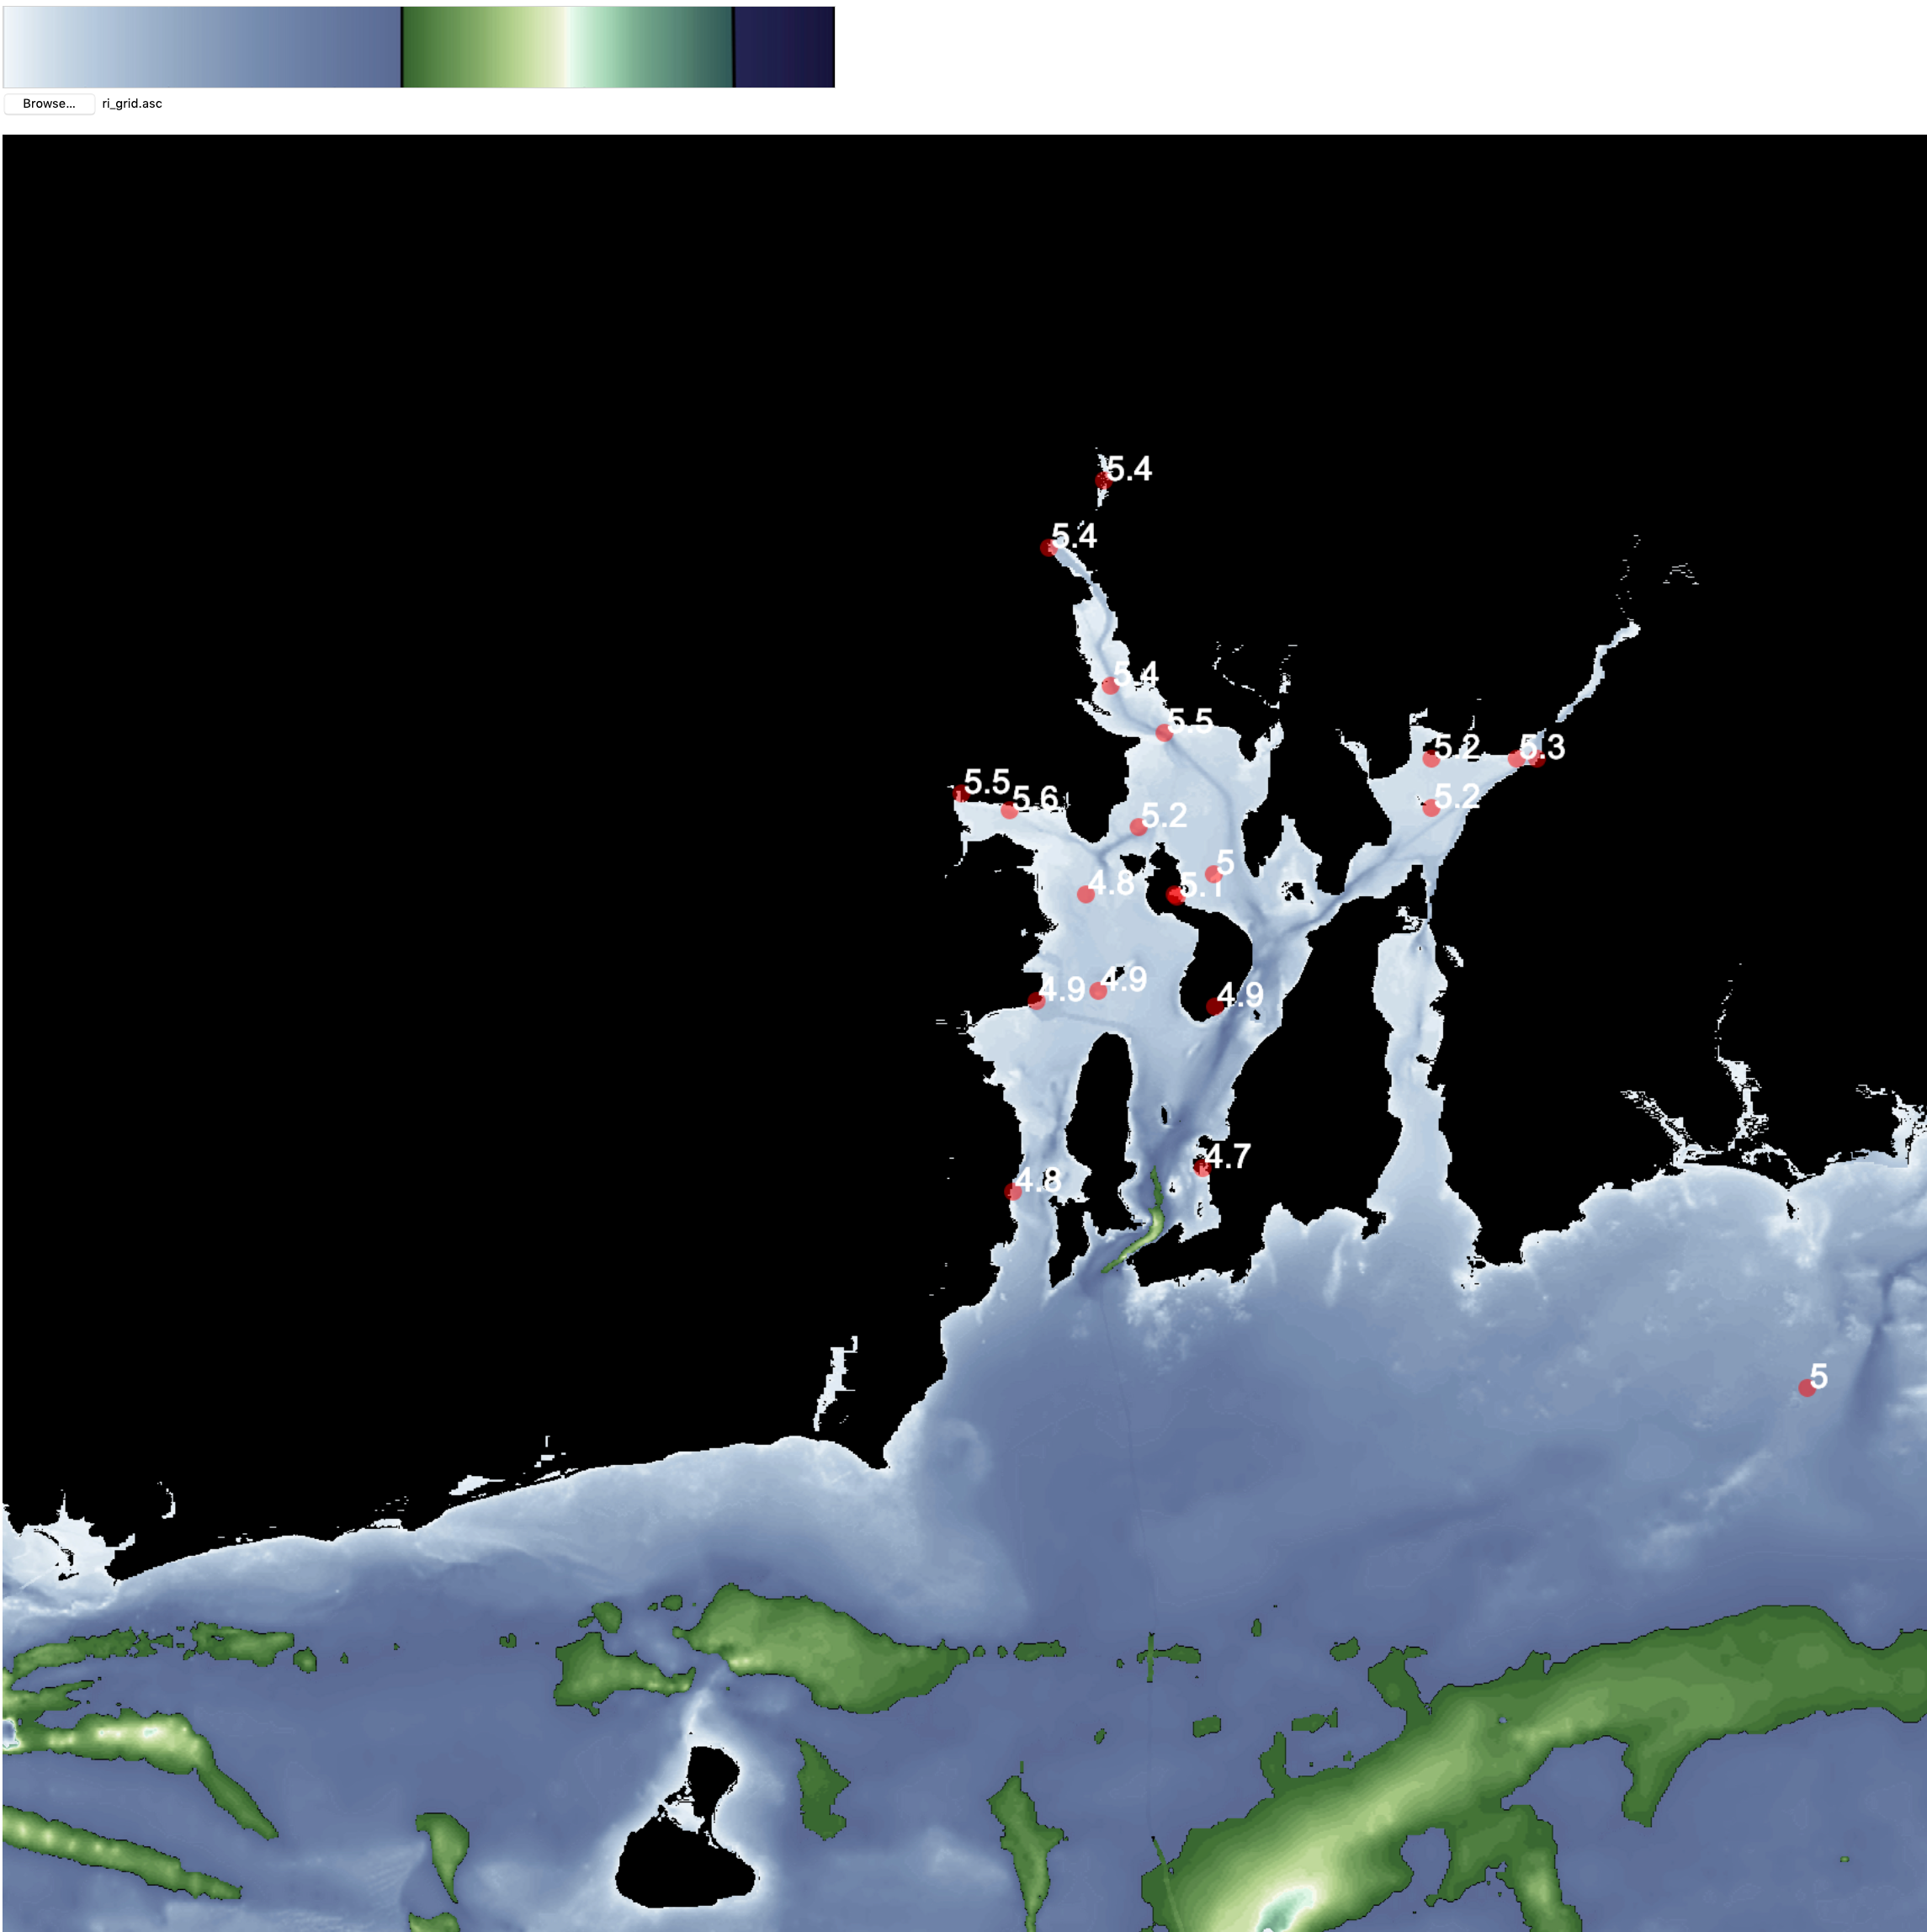
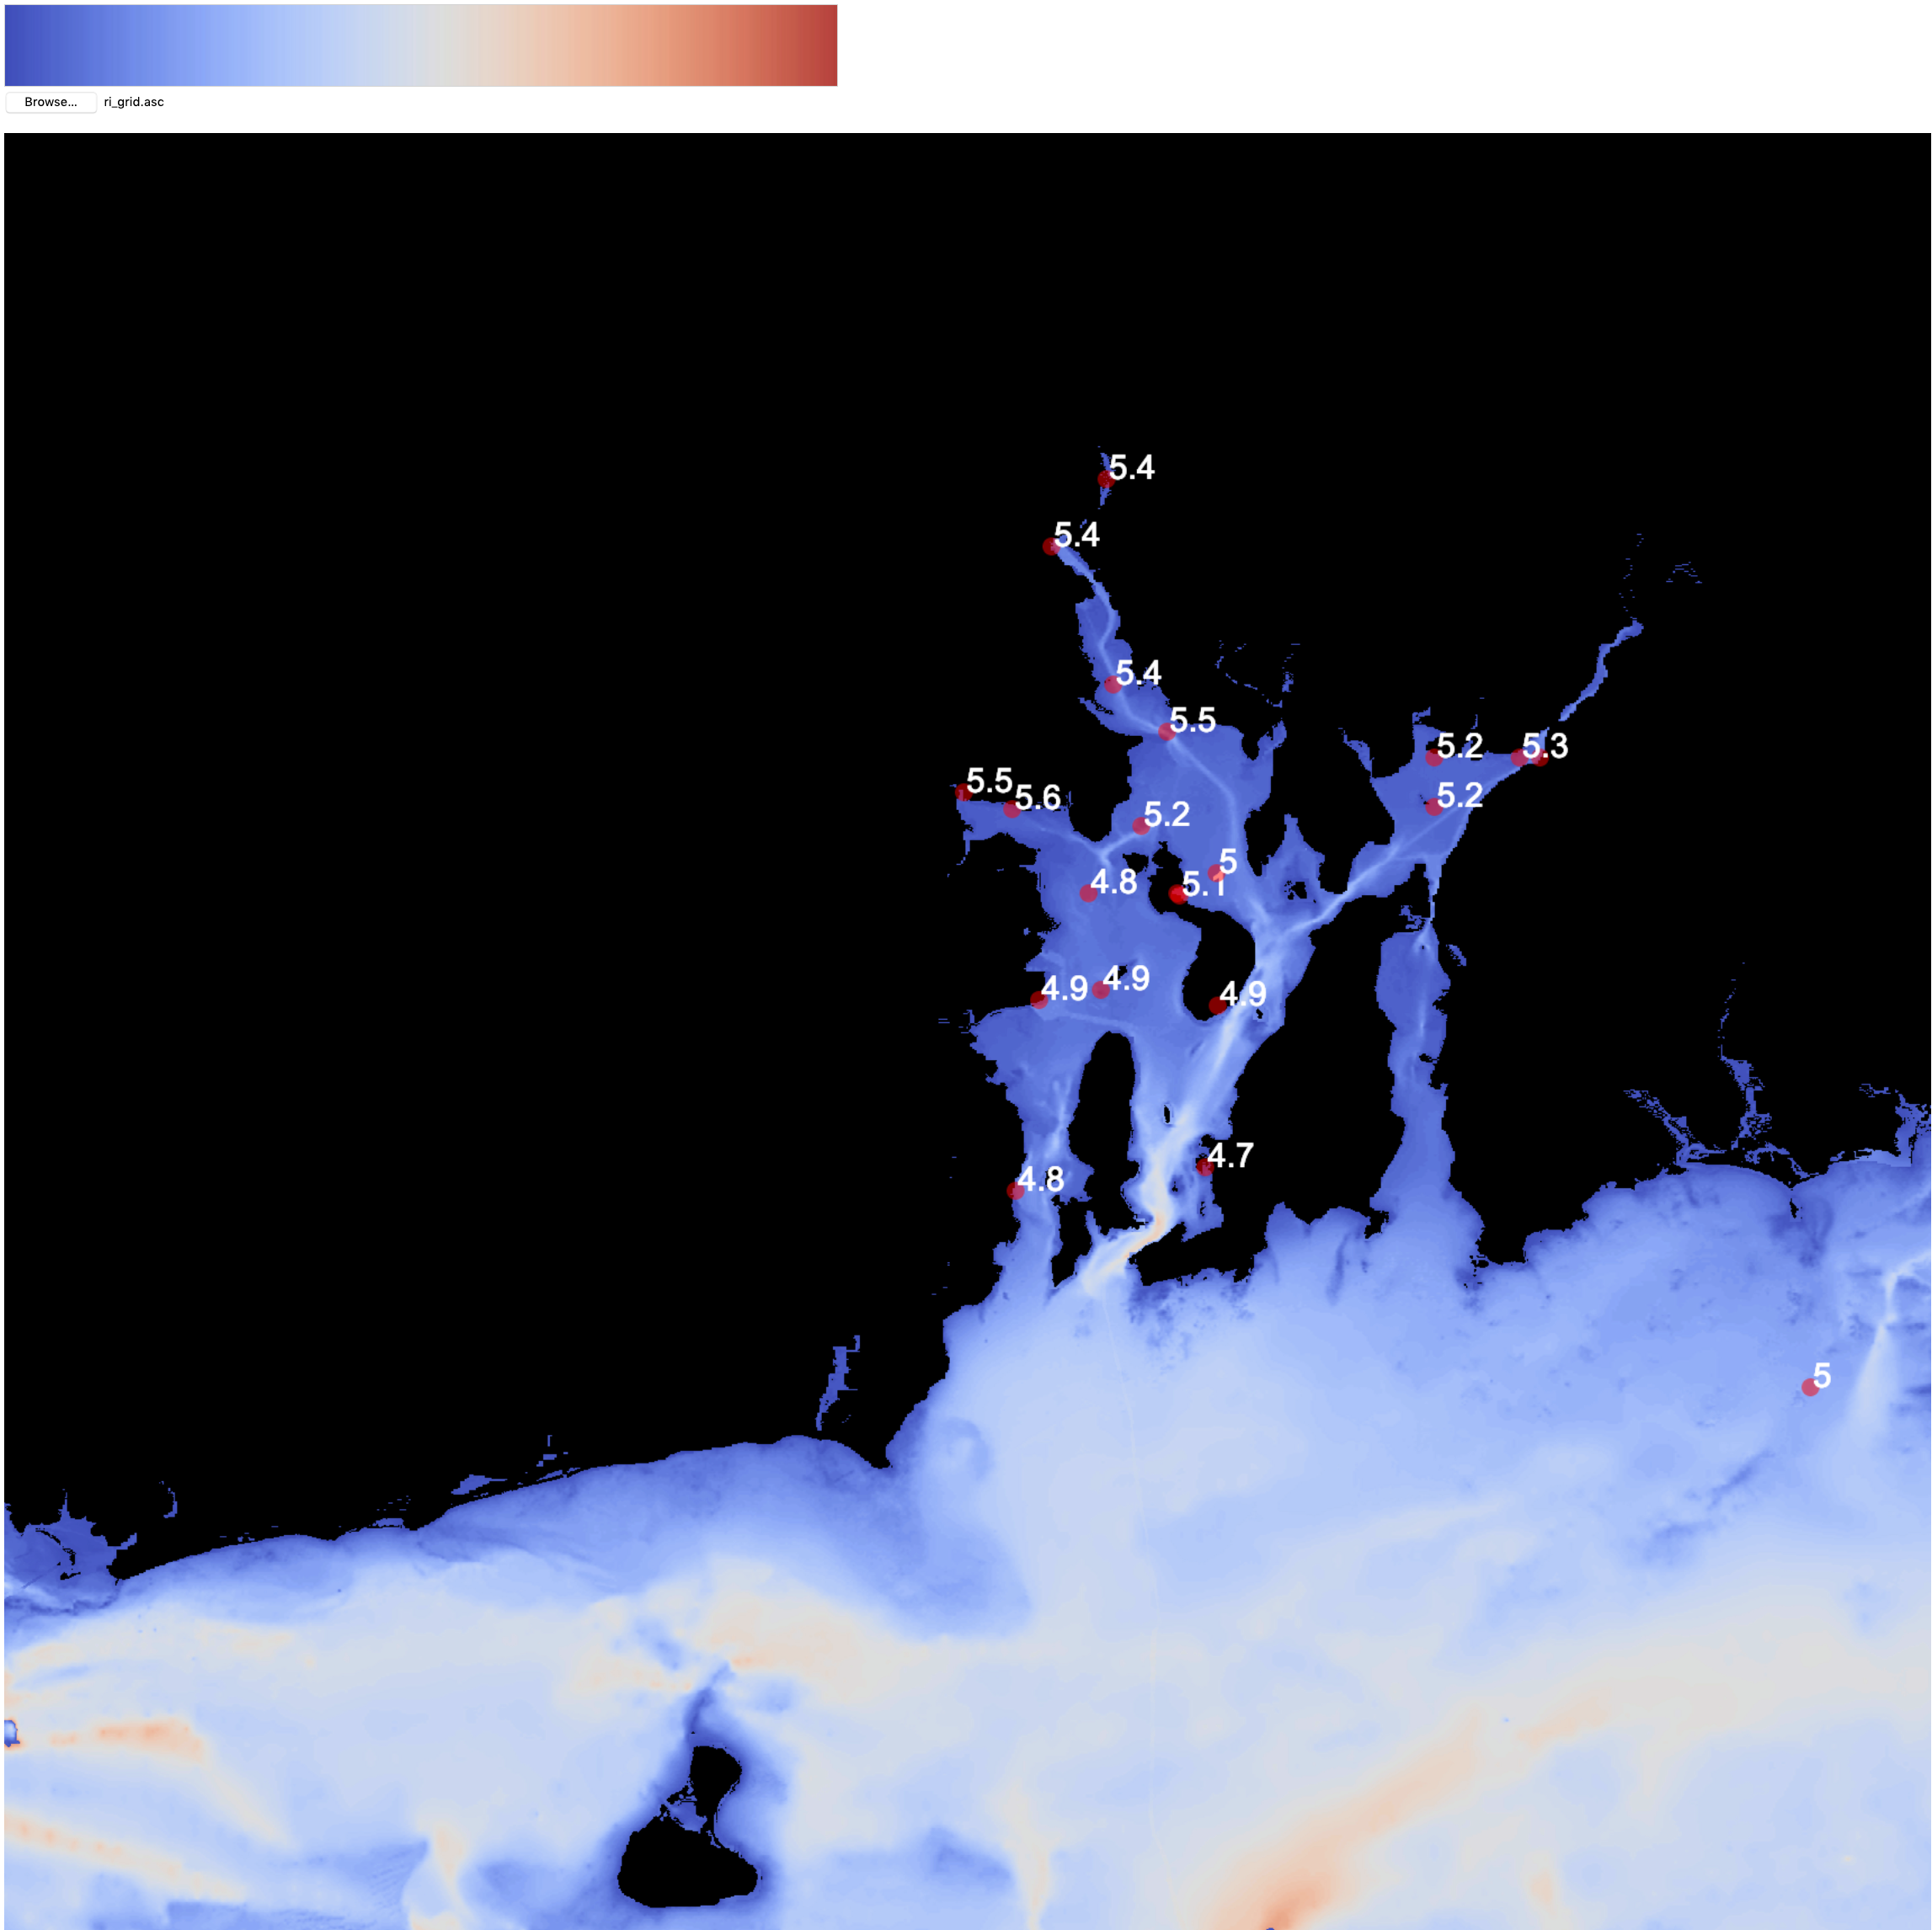
We then ran an exercise to explore the use of color gradients — determining how many each of us can sense (using four different color maps, three with mostly blue and green)?
The game compared the use of four color gradients, made available in a class archive and the ri_grid.asc file.
The class' bathy-image.html file contents build upon the JavaScript code shared in weeks 1 and 2, to create a visual output similar to the Python notebook explored last week. Notes on the code highlight:
The buoy plot data is rendered in a separate HTML5 canvas:
The script.js file is updated to draw buoy locations and water temperature values using compliant HTML5 canvas drawing code. The top location for items is determined from the latitude of the buoy while the left location is determined from the longitude of the buoy. Two conversion functions are provided to map to visual basemap locations.
He asked students to rate themselves regarding Color blindness.
Bruce led a discussion regarding the color differentiation activity's results (describing the differences seen in the four different color mapping gradients):
He then asked students to read a paper that might add some additional insight into the game results (the gradients we used in class come from the paper's figures):
Samsel's Colormaps that Improve Perception of High-Resolution Ocean Data
Applying the color mapping techniques from the paper's figures (as done in the images above) provided useful conclusions, but not as dramatically due to the differences in the spread of values compared to the data in the paper. Students were asked to try to adjust the PNG files provided to use the benefit of the conclusions to the data spread for bathymetry in Narragansett Bay.
Hornung's Seeing Color
Tufte's Chapter 3
Zwimpfer's Color Light Sight Sense
Laidlaw's Visualization Viewpoint
We then ran an exercise to explore the use of color gradients — determining how many each of us can sense (using four different color maps, three with mostly blue and green)?
The game compared the use of four color gradients, made available in a class archive and the ri_grid.asc file.
The class' bathy-image.html file contents build upon the JavaScript code shared in weeks 1 and 2, to create a visual output similar to the Python notebook explored last week. Notes on the code highlight:
The buoy plot data is rendered in a separate HTML5 canvas:
    <canvas id="buoyCanvas" width="2500" height="2500"
            style="position:absolute;top:116px;left:0;z-index:2;background-color:transparent">
    	Your browser does not support HTML5 image-based color mapping.
    </canvas>
whereby the z-index value of 2 assures it appears in front of the basemap (which has a z-index of 0 by default).
The script.js file is updated to draw buoy locations and water temperature values using compliant HTML5 canvas drawing code. The top location for items is determined from the latitude of the buoy while the left location is determined from the longitude of the buoy. Two conversion functions are provided to map to visual basemap locations.
He asked students to rate themselves regarding Color blindness.
Bruce led a discussion regarding the color differentiation activity's results (describing the differences seen in the four different color mapping gradients):
He then asked students to read a paper that might add some additional insight into the game results (the gradients we used in class come from the paper's figures):
Samsel's Colormaps that Improve Perception of High-Resolution Ocean Data
Applying the color mapping techniques from the paper's figures (as done in the images above) provided useful conclusions, but not as dramatically due to the differences in the spread of values compared to the data in the paper. Students were asked to try to adjust the PNG files provided to use the benefit of the conclusions to the data spread for bathymetry in Narragansett Bay.