

Class on March 18 2019
Bruce started off with an overview of a Python notebook that lets the students play with 3-D vector visualization.
The current data had separate u (east-west), v (north-south), and w (depth) components.

Students played around with the code to see what they could do to improve the plot for readability:

Students then discussed the color map choices for Narragansett Bay bathymetry visualization, after making updates to the visualization application.
One student, having grown up near Lake Superior suggested we create an HTML document (using the same images for color maps) with a style sheet and visualization script to apply her favorite color map choice to Lake Superior ASCII grid data:
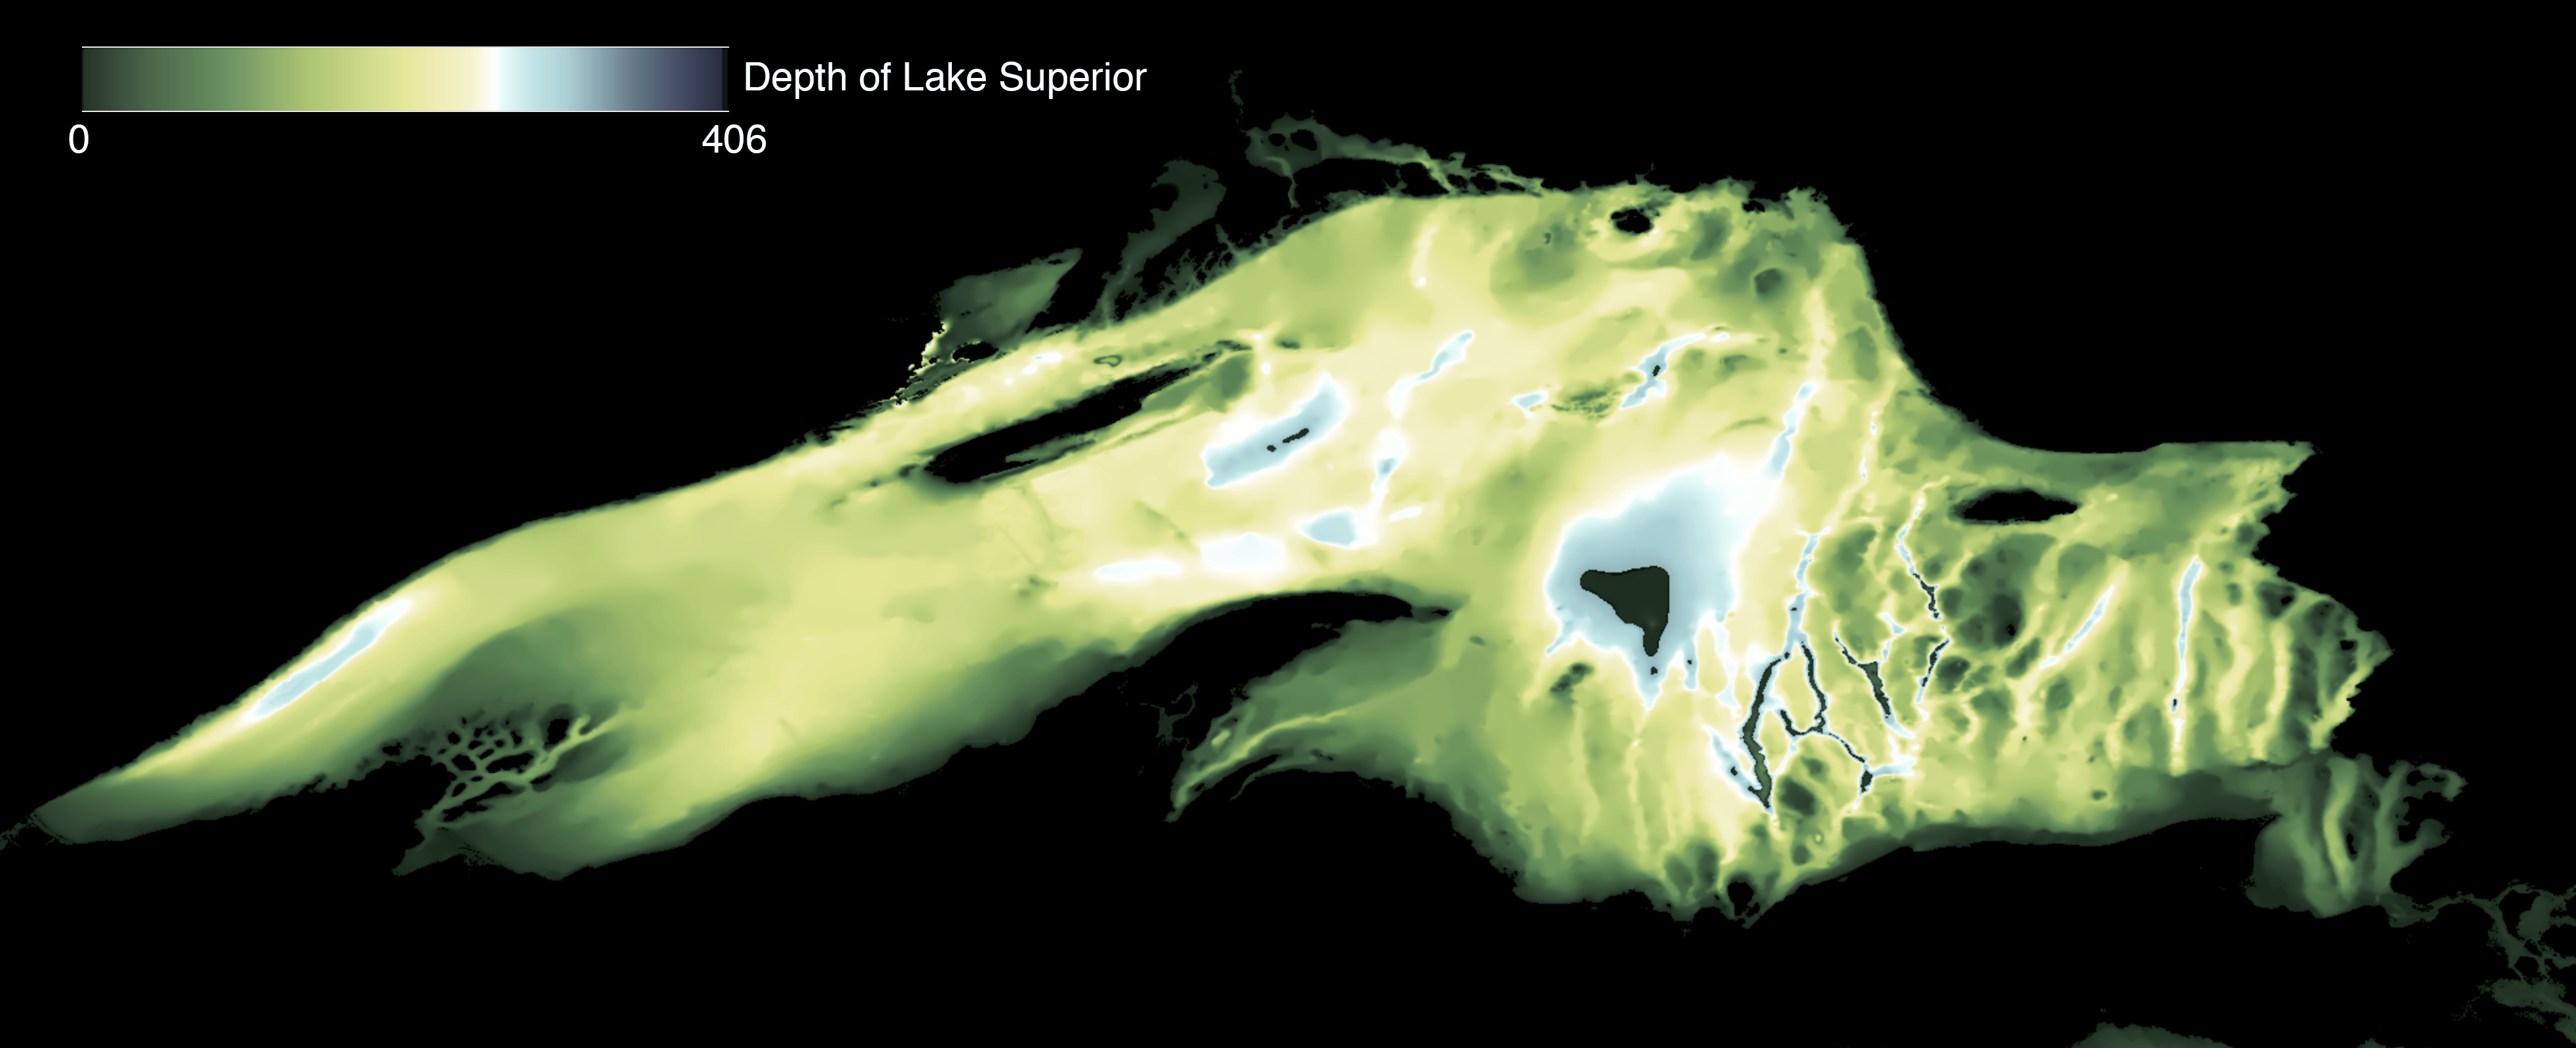
requiring a change to the dimensions of the canvas and a color map spread across 406 meters of depth instead of the 80 meter depth of Narragansett Bay.
Students were asked to play around with the vector visualization Python notebook with the main consideration being how best to represent the 3-D flow in a 2-D image.
The current data had separate u (east-west), v (north-south), and w (depth) components.
Students played around with the code to see what they could do to improve the plot for readability:
Students then discussed the color map choices for Narragansett Bay bathymetry visualization, after making updates to the visualization application.
One student, having grown up near Lake Superior suggested we create an HTML document (using the same images for color maps) with a style sheet and visualization script to apply her favorite color map choice to Lake Superior ASCII grid data:
requiring a change to the dimensions of the canvas and a color map spread across 406 meters of depth instead of the 80 meter depth of Narragansett Bay.
Students were asked to play around with the vector visualization Python notebook with the main consideration being how best to represent the 3-D flow in a 2-D image.