

Curriculum
The PODS Online curriculum begins with five courses
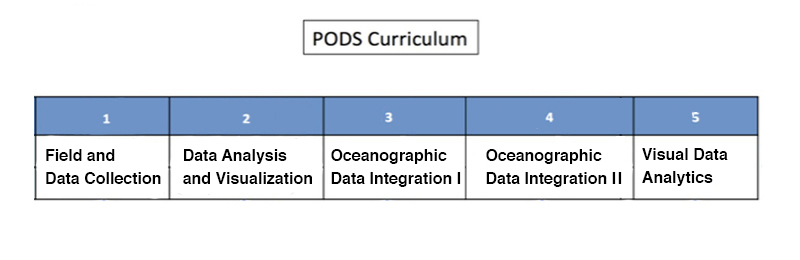
Field and Data Collection
The Field and Data Collection course focuses on the important relationship between field observations and environmental data. Activities include data collection in various coastal environments: a) coastal lagoons/estuaries with concurrent measurements from manned and autonomous kayaks, bay weekly trawls aboard a research vessel, c) open ocean dedicated surveys aboard a research vessel with geophysical mapping systems (multibeam sonar, sub-bottom seismics, LiDAR). In addition, students use low-cost, hands-on instruments that allow group-project teams to take a much more active role in design, deployment and recovery of an observational program. Students experience pedagogical protocols for the use of tilt current meters, thermistor arrays, Lagrangian drifters, and radio-controlled fleet of sensors. Students are introduced to nationally maintained environmental databases (e.g., USGS Streamflow, NOAA-PORTS, National Weather Service) for basic data analysis and comparison. Students also experience an immersive 3-D virtual-reality room to “plant the seed” of a potential goal of the project to generate a 3-D view of a coastal environment. As an end-of-course project, students assemble the various data collected during the course to identify any patterns/trends or determine how representative the data are of long-term conditions.
Data Analysis and Visualization
The Data Analysis and Visualization course use new and previously collected data (field and archived) to expose students to more formal data analysis and presentation techniques. Students are introduced to programming and data analysis basics in a variety of programming environments (e.g., R, Python, MATLAB), focusing primarily on the benefits of open-source software. Basic programming tasks like loading data, assigning/manipulating variables, and plotting with a range of logic (e.g., conditionals and looping) are embedded in the course. More advanced data techniques like trend and error analysis, time-series analysis, and multiparametric statistics are introduced. Students are exposed to various data presentation techniques (e.g., plot types, data overlays, and use of color and symbol size). Students create a final project and report that involves the interpretation and presentation of a multi-dimensional data set (e.g., multiple tide gauges in a coastal lagoon) of their choosing.
Oceanographic Data Integration I
Oceanographic Data Integration I course uses observed and previously identified trends in data to predict, model or simulate phenomena at different spatial (smaller/larger) and/or temporal (past, future) scales. The course covers the basics of conceptual, analog and numerical models while focusing on the relationship of a food web to basic physical and chemical phenomena in an bay environment. Students integrate matrix mathematics into Python coding environments that predict the behavior of nitrogen, phytoplankton, and zooplankton for an increasing sophistication of environmental conditions. Students perform a final project whereby they add new environmental conditions to the bay models previously developed in class or create a new food web model for a different ocean-related environment.
Oceanographic Data Integration II
Oceanographic Data Integration I course uses observed and previously identified trends in data to predict, model or simulate phenomena at different spatial (smaller/larger) and/or temporal (past, future) scales. The course covers more sophisticated analog and numerical models while focusing on the hydrothermodynamics in an bay environment. Students are introduced to the Regional Ocean Modeling System (ROMS) as applied to a bay environment. Students are exposed to MATLAB as a modeling environment and develop their programming skills in parallel with Python as the primary overall programming language. As a final project, students are required to create a new or significantly modify an existing model/simulation. Ideally, the student project could be adapted to be displayed in an advanced visualization environment.
Visual Data Analytics
The Visual Data Analytics course introduced students to popular interactive data visualization techniques that can be delivered via the web to foster collaborative analysis. Students start by using popular web-publishing libraries in the Python environment and then investigate the use of JavaScript libraries (D3, Processing, HTML5 canvas, etc.) to dynamically present data and allow for filtering, aggregating, sorting, painting, correlating, and layering data to drive mental insight processes. Students learn about the physiology of the visual system and how artists apply color theory and see color within their creations. Students learn about relational databases and data modeling to better control collaboration on an oceanographic theme. Students learn about visual analytics as literacy that they then attempt to gain further through visual analytical activities. Students learn about web-based application publishing and create two projects (one ocean-based and the other of personal interest) to workshop via project critiques. The transferability of skills obtained in the PODS online sequence is emphasized throughout.