

Class on May 15 2019
In class workshop of final projects
We began workshopping student final projects that were far enough along that students were willing to share their code via the internal class forum (using an art-style studio process).One project (below) focused on using a D3 data visualization approach augmented by HTML5 canvas processing. The project gave students an opporutnity to review what they had learned from some of the climate change project pieces.
The student is creating an interactive spine alignment visualization to review her chiropractic data by visit:
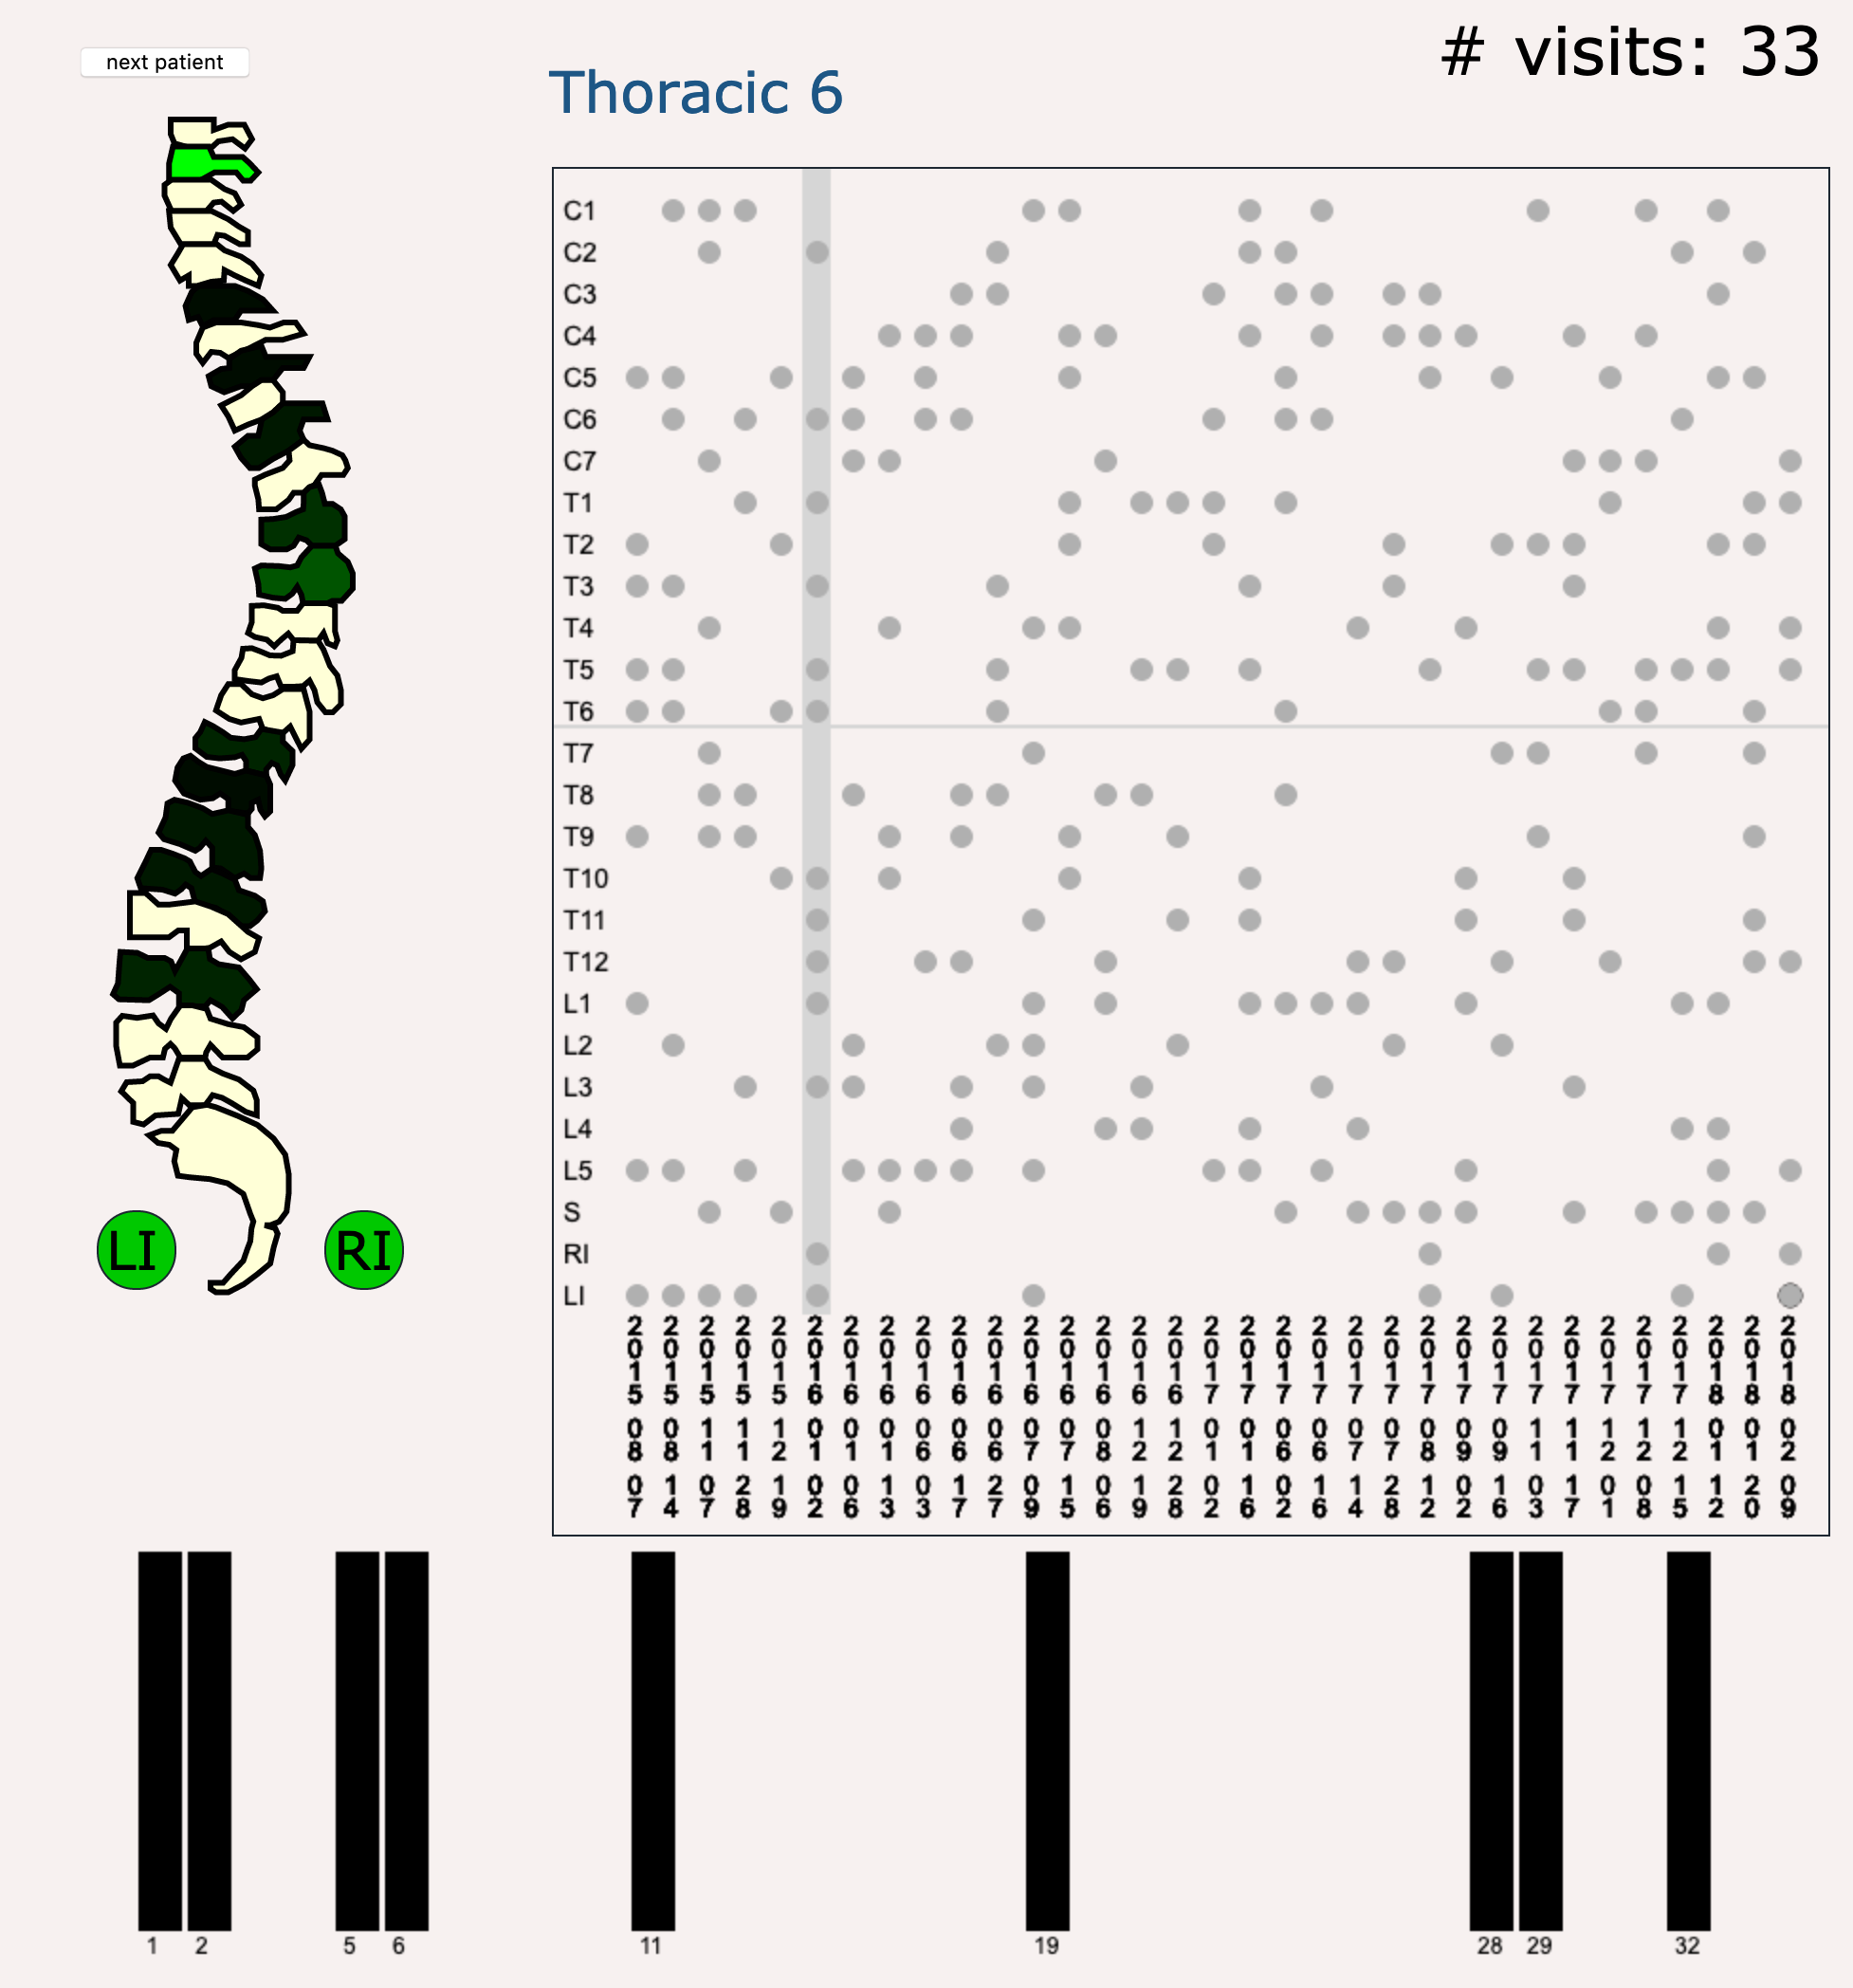
The visualization includes a map of a generic human spine (on the left), with each vertebra created by topoJSON polygon using a reference coordinate system of 50 degrees north to 50 degrees south and a projection to minimize distortion. Of course, a flat polygonal approach could be used instead, but the student wished to reinforce the mapping interface provided in D3.
To the right is a dot plot that had been recommended by another student when project ideas has been informally discussed earlier in the course. The dot plot shows all the dates of chiropractor visit events across the bottom and all vertebrae down the left. Users can click on any vertebra adjustment (represented by grey dot) and update the bar chart and spine visualization.
The spine changes colors to show the total amount of work for the vertebrae that were adjusted on that date's visit. The lighter the shade of green, the more often that vertebra was adjusted. The bar chart shows the pattern of adjustment for the vertebra chosen over the course of treatment to date.
Upon spending time workshopping the result so far with Bruce and the other students, the student came up with a list of suggested changes to be worked on for next week's critique week:
- Change the bar chart to show total work on *all* vertebrae cumulative to the date chosen (since current bar chart shows data already evident in the dot plot)
- Make the bar chart interactive to change the vertebra highlighted in the other visualization components
- Increase the outline stroke width in the spine chart for the selected vertebra of selection
- Debug the visualization for issues like the sacral fill not working and the date selection not working fully in the dot plot