

Class on March 25 2019
Data Modeling
When considering data modeling, students had:- investigated the Wikipedia Page on Data Modeling
- and the MySQL developers' take: Why you want to be good at data modeling
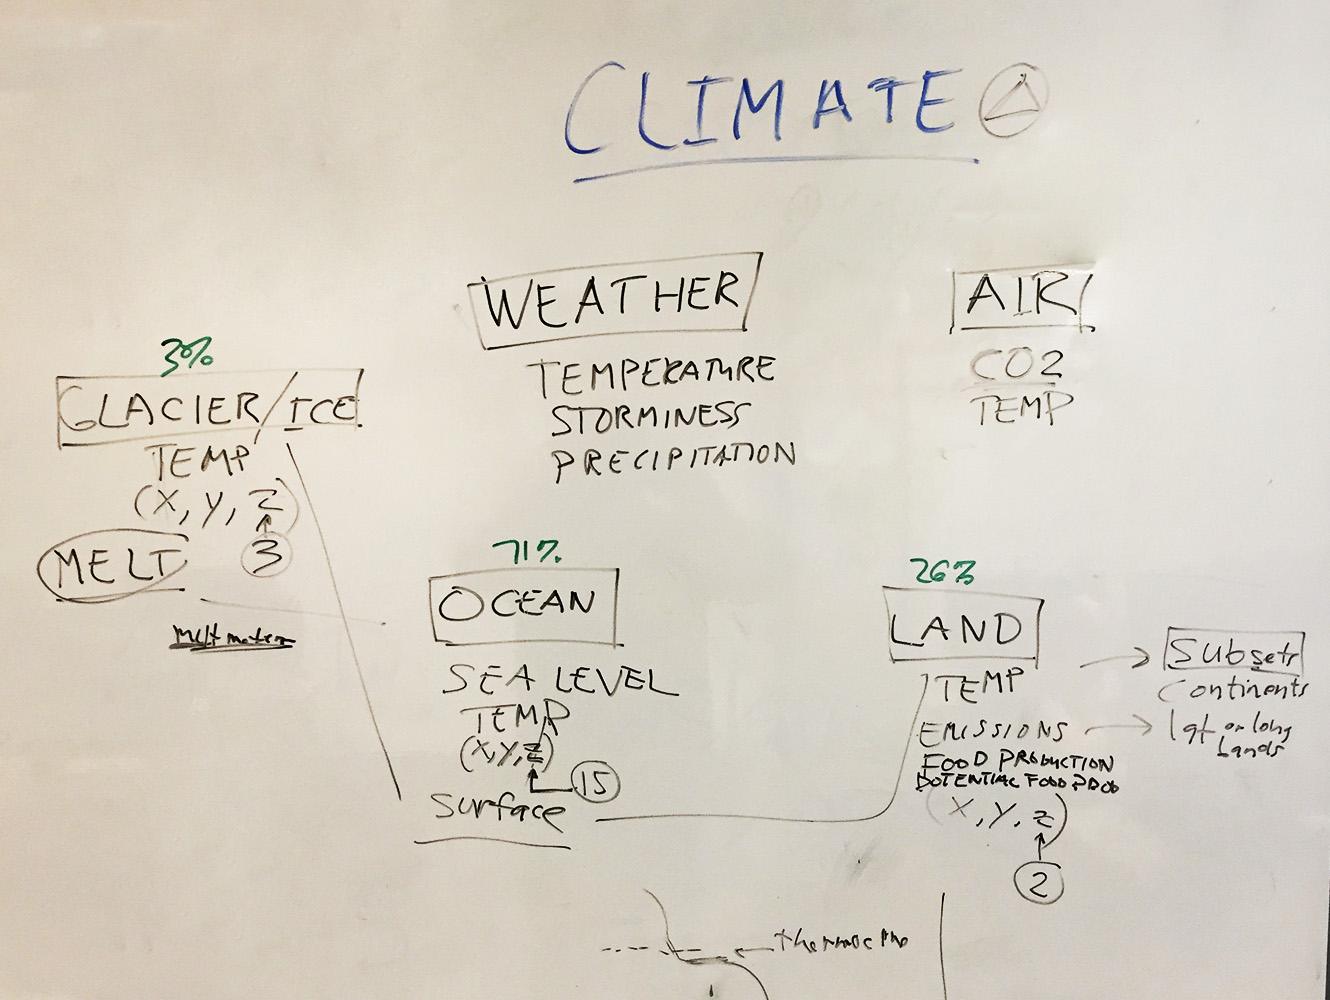
Location and time attributes seemed to be highly important in many of the tables, and the division of the planet's surface into ocean (362.5 x 10¹² m2), land (132.5 x 10¹² m2), and glacier (15 x 1012 m2) seemed useful.
We performed a check proof on the amount of surface on the earth based on the radius of the planet (using surface = 4 * π * radius).
Because climate is such a complex topic, we spent a lot of time discussing how location and time would be represented in the data. Latitude, longitude and depth seemed useful for location (with 15 depth levels for ocean, two for land (surface and sub-surface), three (surface, core, and bottom) for glacier. Since the data we had found for use in our initial visual products was on an annual base, we discussed ways that a finer time step could be implemented to aggregate to the annual values.
We realized we would need to keep the discussion open for the next couple of weeks as we found more data and figured out how to get the data into the database according to useful model that could be then expanded. The fact we found interesting growing days data led us to flush out interesting ways we could represent food production (in terms of potential and actual). We put those attributes in the land table but just as well could have a discussion regarding aquaculture in the ocean.
Much of what we hear about climate change is about the future of weather and so we created a weather entity without being confident it belongs as an entity in its own right.
We can also look to existing data models and taxonomies for ideas. For example, if we were interested in habitat and biodiversity, we could look at Understanding Adaptations of Biodiversity to Climate Change using Taxonomy (a case study).